|
|
|
|
|
|
|
|
|
|
|
|
|
|
|
|
|
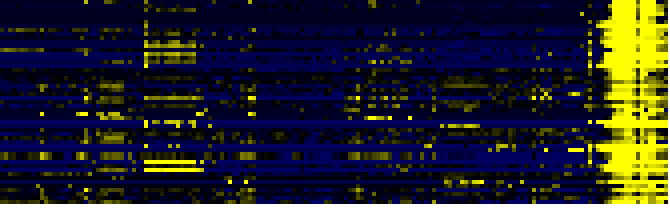
| Pathways co-expressed in the Organ and Tissue data set (with more than 6 annotation points) |
|
CYP71B14 / CYP71B12 / CYP71B13 / expressed protein (At5g25180 / At5g25130 / At5g25140 / At5g25170) |
|
|
|
|
|
|
|
|
| max. difference between log2-ratios: |
6.9 |
|
|
|
|
|
|
|
|
|
|
|
|
| max. difference between log2-ratios excluding lowest and highest 5%: |
4.0 |
|
|
|
|
|
|
|
|
|
|
|
|
| Pathway |
Source |
Scores of Genes |
p[Score] |
No. of Genes |
p[genes] |
Link to organ heatmap |
|
|
|
|
|
|
|
| Miscellaneous acyl lipid metabolism |
AcylLipid |
39 |
0.000 |
8 |
0.243 |
|
|
|
| C-compound and carbohydrate metabolism |
FunCat |
37 |
0.000 |
10 |
0.002 |
|
|
| Synthesis and storage of oil |
AcylLipid |
28 |
0.000 |
8 |
0.000 |
|
|
| glycolysis and gluconeogenesis |
FunCat |
24 |
0.000 |
5 |
0.009 |
|
|
| Phenylpropanoid pathway |
LitPath |
20 |
0.000 |
4 |
0.000 |
|
|
| acyl-CoA binding |
TAIR-GO |
19 |
0.000 |
2 |
0.000 |
|
|
| lipid transport |
TAIR-GO |
19 |
0.000 |
2 |
0.000 |
|
|
| TCA cycle variation VII |
AraCyc |
18 |
0.000 |
3 |
0.018 |
|
|
| Pyruvate metabolism |
KEGG |
18 |
0.000 |
3 |
0.010 |
|
|
| Intermediary Carbon Metabolism |
BioPath |
16 |
0.000 |
3 |
0.072 |
|
|
| glyoxylate cycle |
AraCyc |
16 |
0.000 |
2 |
0.004 |
|
|
| TCA cycle variation VIII |
AraCyc |
16 |
0.000 |
2 |
0.033 |
|
|
| Glyoxylate and dicarboxylate metabolism |
KEGG |
16 |
0.000 |
2 |
0.004 |
|
|
| Phenylpropanoid Metabolism |
BioPath |
15 |
0.004 |
3 |
0.093 |
|
|
|
|
|
|
|
|
|
|
|
| core phenylpropanoid metabolism |
BioPath |
14 |
0.000 |
2 |
0.010 |
|
|
|
|
|
|
|
|
|
|
|
| lipid, fatty acid and isoprenoid metabolism |
FunCat |
14 |
0.000 |
2 |
0.026 |
|
|
|
|
|
|
|
|
|
|
|
| Leaf Glycerolipid Biosynthesis in Plastid |
BioPath |
12 |
0.000 |
2 |
0.019 |
|
|
|
|
|
|
|
|
|
|
|
| lignin biosynthesis |
AraCyc |
12 |
0.000 |
2 |
0.025 |
|
|
|
|
|
|
|
|
|
|
|
| Branched-chain amino acids from aspartate |
BioPath |
10 |
0.000 |
1 |
0.026 |
|
|
|
|
|
|
|
|
|
|
|
| lignin biosynthesis |
TAIR-GO |
10 |
0.000 |
1 |
0.003 |
|
|
|
|
|
|
|
|
|
|
|
| sorbitol fermentation |
AraCyc |
10 |
0.001 |
3 |
0.015 |
|
|
|
|
|
|
|
|
|
|
|
| threonine biosynthesis from homoserine |
AraCyc |
10 |
0.000 |
1 |
0.002 |
|
|
|
|
|
|
|
|
|
|
|
| glyoxylate cycle |
FunCat |
10 |
0.000 |
1 |
0.001 |
|
|
|
|
|
|
|
|
|
|
|
| Glycine, serine and threonine metabolism |
KEGG |
10 |
0.000 |
1 |
0.067 |
|
|
|
|
|
|
|
|
|
|
|
| Vitamin B6 metabolism |
KEGG |
10 |
0.000 |
1 |
0.003 |
|
|
|
|
|
|
|
|
|
|
|
| abscisic acid biosynthesis |
TAIR-GO |
9 |
0.000 |
1 |
0.004 |
|
|
|
|
|
|
|
|
|
|
|
| auxin biosynthesis |
TAIR-GO |
9 |
0.000 |
1 |
0.001 |
|
|
|
|
|
|
|
|
|
|
|
| auxin mediated signaling pathway |
TAIR-GO |
9 |
0.000 |
1 |
0.000 |
|
|
|
|
|
|
|
|
|
|
|
| molybdenum incorporation into molybdenum-molybdopterin complex |
TAIR-GO |
9 |
0.000 |
1 |
0.000 |
|
|
|
|
|
|
|
|
|
|
|
| response to stress |
TAIR-GO |
9 |
0.000 |
1 |
0.001 |
|
|
|
|
|
|
|
|
|
|
|
| sugar mediated signaling |
TAIR-GO |
9 |
0.000 |
1 |
0.001 |
|
|
|
|
|
|
|
|
|
|
|
| IAA biosynthesis |
AraCyc |
9 |
0.000 |
1 |
0.012 |
|
|
|
|
|
|
|
|
|
|
|
| degradation |
FunCat |
9 |
0.000 |
2 |
0.007 |
|
|
|
|
|
|
|
|
|
|
|
| protein degradation |
FunCat |
9 |
0.000 |
2 |
0.003 |
|
|
|
|
|
|
|
|
|
|
|
| mixed acid fermentation |
AraCyc |
8 |
0.000 |
2 |
0.014 |
|
|
|
|
|
|
|
|
|
|
|
| TCA cycle -- aerobic respiration |
AraCyc |
8 |
0.002 |
2 |
0.030 |
|
|
|
|
|
|
|
|
|
|
|
| Carbon fixation |
KEGG |
8 |
0.002 |
2 |
0.041 |
|
|
|
|
|
|
|
|
|
|
|
| Citrate cycle (TCA cycle) |
KEGG |
8 |
0.000 |
2 |
0.012 |
|
|
|
|
|
|
|
|
|
|
|
| Transcription |
KEGG |
8 |
0.001 |
2 |
0.062 |
|
|
|
|
|
|
|
|
|
|
|
| secondary metabolism |
TAIR-GO |
7 |
0.000 |
1 |
0.000 |
|
|
|
|
|
|
|
|
|
|
|
|
|
|
|
|
|
|
|
|
|
|
|
|
|
|
|
|
|
|
|
|
|
|
|
|
|
|
|
|
|
|
|
|
|
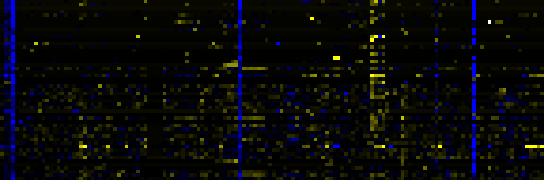
| Pathways co-expressed in the Hormone etc. data set (with more than 6 annotation points) |
|
CYP71B14 / CYP71B12 / CYP71B13 / expressed protein (At5g25180 / At5g25130 / At5g25140 / At5g25170) |
|
|
|
|
|
|
|
|
| max. difference between log2-ratios: |
4.6 |
|
|
|
|
|
|
|
|
|
|
|
|
| max. difference between log2-ratios excluding lowest and highest 5%: |
0.4 |
|
|
|
|
|
|
|
|
|
|
|
|
| Pathway |
Source |
Scores of Genes |
p[Score] |
No. of Genes |
p[genes] |
Link to hormones etc. heatmap |
|
|
|
|
|
|
|
| Synthesis and storage of oil |
AcylLipid |
26 |
0.000 |
7 |
0.000 |
|
|
|
|
|
|
|
| gibberellin biosynthesis |
AraCyc |
22 |
0.000 |
3 |
0.000 |
|
|
|
|
|
|
| secondary metabolism |
FunCat |
22 |
0.000 |
3 |
0.005 |
|
|
|
|
|
|
| Gibberellin metabolism |
LitPath |
22 |
0.000 |
3 |
0.000 |
|
|
|
|
|
|
| giberelin biosynthesis |
LitPath |
22 |
0.000 |
3 |
0.000 |
|
|
|
|
|
|
| gibberellic acid biosynthesis |
TAIR-GO |
20 |
0.000 |
2 |
0.000 |
|
|
|
|
|
|
| C-compound and carbohydrate metabolism |
FunCat |
20 |
0.035 |
4 |
0.183 |
|
|
|
|
|
|
| Diterpenoid biosynthesis |
KEGG |
20 |
0.000 |
2 |
0.000 |
|
|
|
|
|
|
| Biosynthesis of Amino Acids and Derivatives |
BioPath |
18 |
0.000 |
5 |
0.001 |
|
|
|
|
|
|
| Glutathione metabolism |
BioPath |
16 |
0.000 |
4 |
0.000 |
|
|
|
|
|
|
| glycolysis and gluconeogenesis |
FunCat |
16 |
0.000 |
3 |
0.044 |
|
|
|
|
|
|
| toxin catabolism |
TAIR-GO |
14 |
0.000 |
3 |
0.001 |
|
|
|
|
|
|
| Pyruvate metabolism |
KEGG |
14 |
0.000 |
2 |
0.024 |
|
|
|
|
|
|
| Glutathione metabolism |
KEGG |
12 |
0.000 |
2 |
0.006 |
|
|
|
|
|
|
|
|
|
|
|
| Glycine, serine and threonine metabolism |
KEGG |
11 |
0.000 |
2 |
0.004 |
|
|
|
|
|
|
|
|
|
|
|
| Intermediary Carbon Metabolism |
BioPath |
10 |
0.006 |
1 |
0.289 |
|
|
|
|
|
|
|
|
|
|
|
| acyl-CoA binding |
TAIR-GO |
10 |
0.000 |
1 |
0.000 |
|
|
|
|
|
|
|
|
|
|
|
| glucosinolate biosynthesis |
TAIR-GO |
10 |
0.000 |
1 |
0.002 |
|
|
|
|
|
|
|
|
|
|
|
| lipid transport |
TAIR-GO |
10 |
0.000 |
1 |
0.002 |
|
|
|
|
|
|
|
|
|
|
|
| glucosinolate biosynthesis from homomethionine |
AraCyc |
10 |
0.000 |
1 |
0.001 |
|
|
|
|
|
|
|
|
|
|
|
| biosynthesis of phenylpropanoids |
FunCat |
10 |
0.000 |
1 |
0.058 |
|
|
|
|
|
|
|
|
|
|
|
| biosynthesis of secondary products derived from L-phenylalanine and L-tyrosine |
FunCat |
10 |
0.000 |
1 |
0.058 |
|
|
|
|
|
|
|
|
|
|
|
| plant / fungal specific systemic sensing and response |
FunCat |
10 |
0.000 |
1 |
0.020 |
|
|
|
|
|
|
|
|
|
|
|
| plant hormonal regulation |
FunCat |
10 |
0.000 |
1 |
0.020 |
|
|
|
|
|
|
|
|
|
|
|
| tricarboxylic-acid pathway (citrate cycle, Krebs cycle, TCA cycle) |
FunCat |
10 |
0.029 |
1 |
0.327 |
|
|
|
|
|
|
|
|
|
|
|
| Butanoate metabolism |
KEGG |
10 |
0.000 |
1 |
0.020 |
|
|
|
|
|
|
|
|
|
|
|
| Glycolysis / Gluconeogenesis |
KEGG |
10 |
0.000 |
1 |
0.145 |
|
|
|
|
|
|
|
|
|
|
|
| Valine, leucine and isoleucine biosynthesis |
KEGG |
10 |
0.000 |
1 |
0.029 |
|
|
|
|
|
|
|
|
|
|
|
| Glucosinolate Metabolism |
LitPath |
10 |
0.000 |
1 |
0.029 |
|
|
|
|
|
|
|
|
|
|
|
| photorespiration |
TAIR-GO |
9 |
0.000 |
1 |
0.001 |
|
|
|
|
|
|
|
|
|
|
|
| glycine biosynthesis I |
AraCyc |
9 |
0.000 |
1 |
0.057 |
|
|
|
|
|
|
|
|
|
|
|
| photorespiration |
AraCyc |
9 |
0.000 |
1 |
0.037 |
|
|
|
|
|
|
|
|
|
|
|
| superpathway of serine and glycine biosynthesis II |
AraCyc |
9 |
0.000 |
1 |
0.016 |
|
|
|
|
|
|
|
|
|
|
|
| ascorbic acid biosynthesis |
BioPath |
8 |
0.000 |
1 |
0.008 |
|
|
|
|
|
|
|
|
|
|
|
| phenylalanine degradation I |
AraCyc |
8 |
0.000 |
2 |
0.002 |
|
|
|
|
|
|
|
|
|
|
|
| tyrosine degradation |
AraCyc |
8 |
0.000 |
2 |
0.000 |
|
|
|
|
|
|
|
|
|
|
|
| Tyrosine metabolism |
KEGG |
8 |
0.000 |
2 |
0.005 |
|
|
|
|
|
|
|
|
|
|
|
|
|
|
|
|
|
|
|
|
|
|
|
|
|
|
|
|
|
|
|
|
|
|
|
|
|
|
|
|
|
|
|
|
|
|
|
|
|
|
|
|
|
|
|
|
|
|
|
|
|
|
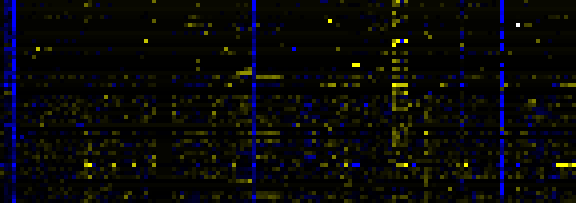
| Pathways co-expressed in the Mutant data set (with more than 6 annotation points) |
|
CYP71B14 / CYP71B12 / CYP71B13 / expressed protein (At5g25180 / At5g25130 / At5g25140 / At5g25170) |
|
|
|
|
|
|
|
|
| max. difference between log2-ratios: |
7.0 |
|
|
|
|
|
|
|
|
|
|
|
|
| max. difference between log2-ratios excluding lowest and highest 5%: |
1.1 |
|
|
|
|
|
|
|
|
|
|
|
|
| Pathway |
Source |
Scores of Genes |
p[Score] |
No. of Genes |
p[genes] |
Link to mutants heatmap |
|
|
|
|
|
|
|
| Ribosome |
KEGG |
30 |
0.000 |
6 |
0.007 |
|
|
|
|
| Synthesis and storage of oil |
AcylLipid |
20 |
0.000 |
6 |
0.000 |
|
|
|
| Biosynthesis of Amino Acids and Derivatives |
BioPath |
14 |
0.000 |
2 |
0.171 |
|
|
|
| protein synthesis |
FunCat |
14 |
0.027 |
3 |
0.131 |
|
|
|
| secondary metabolism |
FunCat |
12 |
0.000 |
2 |
0.067 |
|
|
|
| Folding, Sorting and Degradation |
KEGG |
12 |
0.000 |
5 |
0.000 |
|
|
|
| transport |
FunCat |
11 |
0.000 |
2 |
0.000 |
|
|
|
| Intermediary Carbon Metabolism |
BioPath |
10 |
0.005 |
2 |
0.152 |
|
|
|
| Lysin from aspartate |
BioPath |
10 |
0.000 |
1 |
0.001 |
|
|
|
| acyl-CoA binding |
TAIR-GO |
10 |
0.000 |
1 |
0.000 |
|
|
|
| gibberellic acid biosynthesis |
TAIR-GO |
10 |
0.000 |
1 |
0.006 |
|
|
|
| lipid transport |
TAIR-GO |
10 |
0.000 |
1 |
0.002 |
|
|
|
| gibberellin biosynthesis |
AraCyc |
10 |
0.000 |
1 |
0.012 |
|
|
|
| lysine biosynthesis I |
AraCyc |
10 |
0.000 |
1 |
0.023 |
|
|
|
|
|
|
|
|
|
|
|
| non-oxidative branch of the pentose phosphate pathway |
AraCyc |
10 |
0.000 |
2 |
0.001 |
|
|
|
|
|
|
|
|
|
|
|
| oxidative branch of the pentose phosphate pathway |
AraCyc |
10 |
0.000 |
2 |
0.001 |
|
|
|
|
|
|
|
|
|
|
|
| biosynthesis of lysine |
FunCat |
10 |
0.000 |
1 |
0.002 |
|
|
|
|
|
|
|
|
|
|
|
| metabolism of the aspartate family |
FunCat |
10 |
0.000 |
1 |
0.006 |
|
|
|
|
|
|
|
|
|
|
|
| pentose-phosphate pathway |
FunCat |
10 |
0.000 |
2 |
0.004 |
|
|
|
|
|
|
|
|
|
|
|
| plant / fungal specific systemic sensing and response |
FunCat |
10 |
0.000 |
1 |
0.035 |
|
|
|
|
|
|
|
|
|
|
|
| plant hormonal regulation |
FunCat |
10 |
0.000 |
1 |
0.035 |
|
|
|
|
|
|
|
|
|
|
|
| Diterpenoid biosynthesis |
KEGG |
10 |
0.000 |
1 |
0.005 |
|
|
|
|
|
|
|
|
|
|
|
| Lysine biosynthesis |
KEGG |
10 |
0.000 |
1 |
0.005 |
|
|
|
|
|
|
|
|
|
|
|
| Proteasome |
KEGG |
10 |
0.000 |
4 |
0.000 |
|
|
|
|
|
|
|
|
|
|
|
| Gibberellin metabolism |
LitPath |
10 |
0.000 |
1 |
0.024 |
|
|
|
|
|
|
|
|
|
|
|
| giberelin biosynthesis |
LitPath |
10 |
0.000 |
1 |
0.014 |
|
|
|
|
|
|
|
|
|
|
|
| mono-/sesqui-/di-terpene biosynthesis |
LitPath |
10 |
0.000 |
1 |
0.072 |
|
|
|
|
|
|
|
|
|
|
|
| sequiterpene biosynthesis |
LitPath |
10 |
0.000 |
1 |
0.000 |
|
|
|
|
|
|
|
|
|
|
|
| terpenoid metabolism |
LitPath |
10 |
0.000 |
1 |
0.076 |
|
|
|
|
|
|
|
|
|
|
|
| abscisic acid biosynthesis |
TAIR-GO |
9 |
0.000 |
1 |
0.005 |
|
|
|
|
|
|
|
|
|
|
|
| auxin mediated signaling pathway |
TAIR-GO |
9 |
0.000 |
1 |
0.000 |
|
|
|
|
|
|
|
|
|
|
|
| DNA-directed RNA polymerase II, core complex |
TAIR-GO |
9 |
0.000 |
1 |
0.000 |
|
|
|
|
|
|
|
|
|
|
|
| molybdenum incorporation into molybdenum-molybdopterin complex |
TAIR-GO |
9 |
0.000 |
1 |
0.000 |
|
|
|
|
|
|
|
|
|
|
|
| response to stress |
TAIR-GO |
9 |
0.000 |
1 |
0.001 |
|
|
|
|
|
|
|
|
|
|
|
| sugar mediated signaling |
TAIR-GO |
9 |
0.000 |
1 |
0.002 |
|
|
|
|
|
|
|
|
|
|
|
| transcription from RNA polymerase II promoter |
TAIR-GO |
9 |
0.000 |
1 |
0.000 |
|
|
|
|
|
|
|
|
|
|
|
| RNA polymerase |
KEGG |
9 |
0.000 |
1 |
0.052 |
|
|
|
|
|
|
|
|
|
|
|
| Transcription |
KEGG |
9 |
0.000 |
1 |
0.158 |
|
|
|
|
|
|
|
|
|
|
|
| metabolism of acyl-lipids in mitochondria |
AcylLipid |
9 |
0.003 |
2 |
0.036 |
|
|
|
|
|
|
|
|
|
|
|
| sorbitol fermentation |
AraCyc |
8 |
0.001 |
3 |
0.013 |
|
|
|
|
|
|
|
|
|
|
|
| storage protein |
FunCat |
8 |
0.000 |
2 |
0.000 |
|
|
|
|
|
|
|
|
|
|
|
| male gamete generation (sensu Magnoliophyta) |
TAIR-GO |
7 |
0.000 |
1 |
0.000 |
|
|
|
|
|
|
|
|
|
|
|
| secondary metabolism |
TAIR-GO |
7 |
0.000 |
1 |
0.000 |
|
|
|
|
|
|
|
|
|
|
|
| degradation |
FunCat |
7 |
0.000 |
1 |
0.062 |
|
|
|
|
|
|
|
|
|
|
|
| protein degradation |
FunCat |
7 |
0.000 |
1 |
0.035 |
|
|
|
|
|
|
|
|
|
|
|
| transport ATPases |
FunCat |
7 |
0.002 |
1 |
0.089 |
|
|
|
|
|
|
|
|
|
|
|
| transport facilitation |
FunCat |
7 |
0.000 |
1 |
0.001 |
|
|
|
|
|
|
|
|
|
|
|
| Oxidative phosphorylation |
KEGG |
7 |
0.001 |
1 |
0.146 |
|
|
|
|
|
|
|
|
|
|
|
|
|
|
|
|
|
|
|
|
|
|
|
|
|
|
|
|