| _________________________________________ |
|
|
|
|
|
|
|
|
|
|
|
|
|
|
|
| Pathways co-expressed in the 3 data sets with co-expressed pathways (with more than 6 annotation points each) |
|
Find below a list of pathways that are co-expressed with the bait. First a list of pathways is given that are co-expressed in all data sets. Lists for each individual dataset are shown underneath. Depending on the number of co-expressed pathways only the top scoring pathways are given; all data can be saved as text using the link above. |
|
|
|
|
|
|
| Pathway |
Source |
Sum of scores |
Sum of genes |
|
|
|
|
|
|
|
| chorismate biosynthesis |
AraCyc |
86 |
11 |
|
|
|
|
|
|
|
| TCA cycle -- aerobic respiration |
AraCyc |
51 |
8 |
|
|
|
|
|
|
|
| Glycan Biosynthesis and Metabolism |
KEGG |
51 |
8 |
|
|
|
|
|
|
|
|
|
| Miscellaneous acyl lipid metabolism |
AcylLipid |
48 |
14 |
|
To the right of each table a thumbnail of the actual co-expression heatmap is given. Klick on the link to see the heatmap containing all co-expressed genes. |
|
|
|
|
|
|
|
|
| Citrate cycle (TCA cycle) |
KEGG |
46 |
7 |
|
|
|
|
|
|
|
|
|
| TCA cycle variation IV |
AraCyc |
45 |
7 |
|
|
|
|
|
|
|
|
|
| TCA cycle variation VII |
AraCyc |
45 |
7 |
|
For more information on how these pathway maps were generated please read the methods page |
|
|
|
|
|
|
|
|
| TCA cycle variation VIII |
AraCyc |
45 |
7 |
|
|
|
|
|
|
|
|
|
| serine-isocitrate lyase pathway |
AraCyc |
36 |
5 |
|
|
|
|
|
|
|
|
|
|
|
|
|
| Glyoxylate and dicarboxylate metabolism |
KEGG |
34 |
5 |
|
|
|
|
|
|
|
|
|
|
|
|
|
|
|
|
|
|
|
|
|
|
|
|
|
|
|
|
|
|
|
|
|
|
|
|
|
|
|
|
|
|
|
|
|
|
|
| Pathways co-expressed in the Organ and Tissue data set (with more than 16 annotation points) |
|
CYP724A1 (At5g14400) |
|
|
|
|
|
|
|
|
| max. difference between log2-ratios: |
7.4 |
|
|
|
|
|
|
|
|
|
|
|
|
| max. difference between log2-ratios excluding lowest and highest 5%: |
6.3 |
|
|
|
|
|
|
|
|
|
|
|
|
| Pathway |
Source |
Scores of Genes |
p[Score] |
No. of Genes |
p[genes] |
Link to organ heatmap |
|
|
|
|
|
|
|
| Folding, Sorting and Degradation |
KEGG |
49 |
0.000 |
10 |
0.026 |

|
|
|
| protein synthesis |
FunCat |
38 |
0.000 |
11 |
0.002 |
|
|
| Nicotinate and nicotinamide metabolism |
KEGG |
38 |
0.000 |
10 |
0.004 |
|
|
| Transcription |
KEGG |
38 |
0.000 |
10 |
0.002 |
|
|
| Translation factors |
KEGG |
37 |
0.000 |
13 |
0.000 |
|
|
| Benzoate degradation via CoA ligation |
KEGG |
36 |
0.000 |
9 |
0.019 |
|
|
| Inositol phosphate metabolism |
KEGG |
36 |
0.000 |
9 |
0.033 |
|
|
| RNA polymerase |
KEGG |
34 |
0.000 |
8 |
0.000 |
|
|
| TCA cycle -- aerobic respiration |
AraCyc |
29 |
0.000 |
5 |
0.001 |
|
|
| nucleotide metabolism |
FunCat |
25 |
0.000 |
5 |
0.000 |
|
|
| Glycan Biosynthesis and Metabolism |
KEGG |
25 |
0.001 |
5 |
0.118 |
|
|
| Aromatic amino acid (Phe, Tyr, Trp) metabolism |
BioPath |
24 |
0.000 |
4 |
0.003 |
|
|
| Intermediary Carbon Metabolism |
BioPath |
24 |
0.012 |
4 |
0.161 |
|
|
| tricarboxylic-acid pathway (citrate cycle, Krebs cycle, TCA cycle) |
FunCat |
24 |
0.012 |
4 |
0.323 |
|
|
|
|
|
|
|
|
|
|
|
| Citrate cycle (TCA cycle) |
KEGG |
24 |
0.000 |
4 |
0.065 |
|
|
|
|
|
|
|
|
|
|
|
| TCA cycle variation IV |
AraCyc |
23 |
0.000 |
4 |
0.005 |
|
|
|
|
|
|
|
|
|
|
|
| TCA cycle variation VII |
AraCyc |
23 |
0.000 |
4 |
0.029 |
|
|
|
|
|
|
|
|
|
|
|
| TCA cycle variation VIII |
AraCyc |
23 |
0.000 |
4 |
0.007 |
|
|
|
|
|
|
|
|
|
|
|
| RNA synthesis |
FunCat |
22 |
0.000 |
6 |
0.000 |
|
|
|
|
|
|
|
|
|
|
|
| transcription |
FunCat |
22 |
0.000 |
6 |
0.000 |
|
|
|
|
|
|
|
|
|
|
|
| Protein export |
KEGG |
22 |
0.000 |
4 |
0.017 |
|
|
|
|
|
|
|
|
|
|
|
| Reductive carboxylate cycle (CO2 fixation) |
KEGG |
22 |
0.000 |
3 |
0.020 |
|
|
|
|
|
|
|
|
|
|
|
| mRNA synthesis |
FunCat |
20 |
0.000 |
5 |
0.000 |
|
|
|
|
|
|
|
|
|
|
|
| Phenylalanine, tyrosine and tryptophan biosynthesis |
KEGG |
18 |
0.033 |
3 |
0.195 |
|
|
|
|
|
|
|
|
|
|
|
| fatty acid biosynthesis -- initial steps |
AraCyc |
17 |
0.000 |
3 |
0.008 |
|
|
|
|
|
|
|
|
|
|
|
|
|
|
|
|
|
|
|
|
|
|
|
|
|
|
|
|
|
|
|
|
|
|
|
|
|
|
|
|
|
|
|
|
|
| Pathways co-expressed in the Hormone etc. data set (with more than 19 annotation points) |
|
CYP724A1 (At5g14400) |
|
|
|
|
|
|
|
|
| max. difference between log2-ratios: |
0.4 |
|
|
|
|
|
|
|
|
|
|
|
|
| max. difference between log2-ratios excluding lowest and highest 5%: |
0.0 |
|
|
|
|
|
|
|
|
|
|
|
|
| Pathway |
Source |
Scores of Genes |
p[Score] |
No. of Genes |
p[genes] |
Link to hormones etc. heatmap |
|
|
|
|
|
|
|
| Cell Wall Carbohydrate Metabolism |
BioPath |
132 |
0.000 |
41 |
0.000 |
|
|
|
|
|
|
| pectin metabolism |
BioPath |
72 |
0.000 |
29 |
0.000 |
|
|
|
|
|
| Ribosome |
KEGG |
44 |
0.030 |
8 |
0.416 |
|
|
|
|
|
| mono-/sesqui-/di-terpene biosynthesis |
LitPath |
32 |
0.000 |
5 |
0.006 |
|
|
|
|
|
| terpenoid metabolism |
LitPath |
32 |
0.000 |
5 |
0.007 |
|
|
|
|
|
| Fructose and mannose metabolism |
KEGG |
30 |
0.000 |
5 |
0.003 |
|
|
|
|
|
| Fatty acid elongation and wax and cutin metabolism |
AcylLipid |
27 |
0.000 |
9 |
0.000 |
|
|
|
|
|
| cellulose biosynthesis |
BioPath |
26 |
0.000 |
5 |
0.018 |
|
|
|
|
|
| nucleotide metabolism |
FunCat |
24 |
0.000 |
6 |
0.000 |
|
|
|
|
|
| Miscellaneous acyl lipid metabolism |
AcylLipid |
22 |
0.028 |
9 |
0.160 |
|
|
|
|
|
| (deoxy)ribose phosphate degradation |
AraCyc |
20 |
0.000 |
4 |
0.000 |
|
|
|
|
|
| biosynthesis of derivatives of homoisopentenyl pyrophosphate |
FunCat |
20 |
0.000 |
2 |
0.024 |
|
|
|
|
|
| pyrimidine nucleotide metabolism |
FunCat |
20 |
0.000 |
4 |
0.001 |
|
|
|
|
|
| Glycolysis / Gluconeogenesis |
KEGG |
20 |
0.001 |
5 |
0.035 |
|
|
|
|
|
|
|
|
|
|
|
| Nucleotide Metabolism |
KEGG |
20 |
0.000 |
4 |
0.093 |
|
|
|
|
|
|
|
|
|
|
|
| Pyrimidine metabolism |
KEGG |
20 |
0.000 |
4 |
0.008 |
|
|
|
|
|
|
|
|
|
|
|
|
|
|
|
|
|
|
|
|
|
|
|
|
|
|
|
|
|
|
|
|
|
|
|
|
|
|
|
|
|
|
|
|
|
|
|
|
|
|
|
|
|
|
|
|
|
|
|
|
|
|
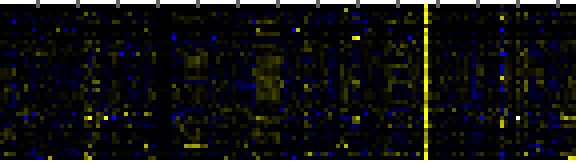
| Pathways co-expressed in the Mutant data set (with more than 10 annotation points) |
|
CYP724A1 (At5g14400) |
|
|
|
|
|
|
|
|
| max. difference between log2-ratios: |
4.6 |
|
|
|
|
|
|
|
|
|
|
|
|
| max. difference between log2-ratios excluding lowest and highest 5%: |
0.0 |
|
|
|
|
|
|
|
|
|
|
|
|
| Pathway |
Source |
Scores of Genes |
p[Score] |
No. of Genes |
p[genes] |
Link to mutants heatmap |
|
|
|
|
|
|
|
| Phenylalanine, tyrosine and tryptophan biosynthesis |
KEGG |
34 |
0.000 |
5 |
0.000 |
|
|
|
|
| Aromatic amino acid (Phe, Tyr, Trp) metabolism |
BioPath |
32 |
0.000 |
4 |
0.000 |
|
|
|
| Phenylpropanoid Metabolism |
BioPath |
32 |
0.000 |
4 |
0.002 |
|
|
|
| aromatic amino acid family biosynthesis |
TAIR-GO |
32 |
0.000 |
4 |
0.000 |
|
|
|
| aromatic amino acid family biosynthesis, shikimate pathway |
TAIR-GO |
32 |
0.000 |
4 |
0.000 |
|
|
|
| chorismate biosynthesis |
LitPath |
32 |
0.000 |
4 |
0.000 |
|
|
|
| Shikimate pathway |
LitPath |
32 |
0.000 |
4 |
0.000 |
|
|
|
| Ribosome |
KEGG |
30 |
0.033 |
5 |
0.234 |
|
|
|
| Translation factors |
KEGG |
30 |
0.000 |
8 |
0.000 |
|
|
|
| chorismate biosynthesis |
AraCyc |
22 |
0.000 |
3 |
0.000 |
|
|
|
| C-compound and carbohydrate metabolism |
FunCat |
22 |
0.002 |
4 |
0.092 |
|
|
|
|
|
|
|
|
|
|
|
| Biosynthesis of Amino Acids and Derivatives |
BioPath |
20 |
0.000 |
2 |
0.063 |
|
|
|
|
|
|
|
|
|
|
|
| Intermediary Carbon Metabolism |
BioPath |
20 |
0.000 |
3 |
0.010 |
|
|
|
|
|
|
|
|
|
|
|
| Glutamate metabolism |
KEGG |
18 |
0.000 |
3 |
0.005 |
|
|
|
|
|
|
|
|
|
|
|
| glyphosate metabolism |
TAIR-GO |
16 |
0.000 |
2 |
0.000 |
|
|
|
|
|
|
|
|
|
|
|
| protein synthesis |
FunCat |
16 |
0.000 |
3 |
0.027 |
|
|
|
|
|
|
|
|
|
|
|
| alanine biosynthesis II |
AraCyc |
12 |
0.000 |
2 |
0.005 |
|
|
|
|
|
|
|
|
|
|
|
| phenylalanine biosynthesis II |
AraCyc |
12 |
0.000 |
2 |
0.003 |
|
|
|
|
|
|
|
|
|
|
|
| glycolysis and gluconeogenesis |
FunCat |
12 |
0.005 |
3 |
0.022 |
|
|
|
|
|
|
|
|
|
|
|
| Miscellaneous acyl lipid metabolism |
AcylLipid |
12 |
0.000 |
2 |
0.000 |
|
|
|
|
|
|
|
|
|
|
|
|
|
|
|
|
|
|
|
|
|
|
|
|
|
|
|
|