| _________________________________________ |
|
|
|
|
|
|
|
|
|
|
|
|
|
|
|
|
| Pathways co-expressed in all 4 data sets (with more than 6 annotation points each) |
|
Find below a list of pathways that are co-expressed with the bait. First a list of pathways is given that are co-expressed in all data sets. Lists for each individual dataset are shown underneath. Depending on the number of co-expressed pathways only the top scoring pathways are given; all data can be saved as text using the link above. |
|
|
|
|
|
|
|
|
| Pathway |
Source |
Sum of scores |
Sum of genes |
|
|
|
|
|
|
|
|
| tryptophan biosynthesis |
TAIR-GO |
342 |
47 |
|
|
|
|
|
|
|
|
| tryptophan biosynthesis |
AraCyc |
342 |
47 |
|
|
|
|
|
|
|
|
| Phenylpropanoid Metabolism |
BioPath |
217 |
36 |
|
|
|
|
|
|
|
|
| Shikimate pathway |
LitPath |
184 |
25 |
|
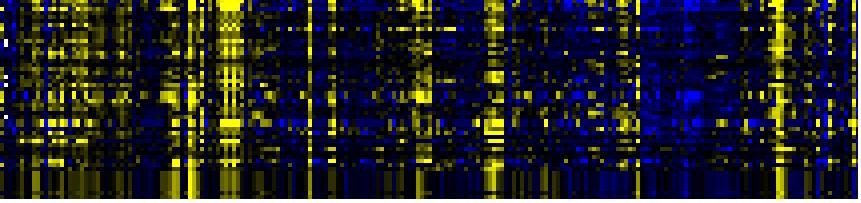
To the right of each table a thumbnail of the actual co-expression heatmap is given. Klick on the link to see the heatmap containing all co-expressed genes. |
|
|
|
|
|
|
|
| Trp biosyntesis |
LitPath |
180 |
24 |
|
|
|
|
|
|
|
|
|
|
| Aromatic amino acid (Phe, Tyr, Trp) metabolism |
BioPath |
166 |
22 |
|
|
|
|
|
|
|
|
|
|
| response to pathogenic bacteria |
TAIR-GO |
150 |
21 |
|
For more information on how these pathway maps were generated please read the methods page |
|
|
|
|
|
|
|
|
|
| Phenylalanine, tyrosine and tryptophan biosynthesis |
KEGG |
96 |
12 |
|
|
|
|
|
|
|
|
|
|
|
|
|
|
|
|
|
|
|
|
|
|
|
|
|
|
|
|
|
|
|
|
|
|
|
|
|
|
|
|
|
|
|
|
| Pathways co-expressed in the Organ and Tissue data set (with more than 6 annotation points) |
|
CYP81F2 (At5g57220) |
|
|
|
|
|
|
|
|
| max. difference between log2-ratios: |
7.4 |
|
|
|
|
|
|
|
|
|
|
|
|
| max. difference between log2-ratios excluding lowest and highest 5%: |
4.6 |
|
|
|
|
|
|
|
|
|
|
|
|
| Pathway |
Source |
Scores of Genes |
p[Score] |
No. of Genes |
p[genes] |
Link to organ heatmap |
|
|
|
|
|
|
|
| Aromatic amino acid (Phe, Tyr, Trp) metabolism |
BioPath |
10 |
0.000 |
1 |
0.002 |

|
|
|
| Phenylpropanoid Metabolism |
BioPath |
10 |
0.000 |
1 |
0.023 |
|
|
| anthranilate synthase complex |
TAIR-GO |
10 |
0.000 |
1 |
0.000 |
|
|
|
|
|
|
|
|
|
|
|
| response to pathogenic bacteria |
TAIR-GO |
10 |
0.000 |
1 |
0.000 |
|
|
|
|
|
|
|
|
|
|
|
| response to wounding |
TAIR-GO |
10 |
0.000 |
1 |
0.001 |
|
|
|
|
|
|
|
|
|
|
|
| tryptophan biosynthesis |
TAIR-GO |
10 |
0.000 |
1 |
0.001 |
|
|
|
|
|
|
|
|
|
|
|
| tryptophan biosynthesis |
AraCyc |
10 |
0.000 |
1 |
0.000 |
|
|
|
|
|
|
|
|
|
|
|
| Phenylalanine, tyrosine and tryptophan biosynthesis |
KEGG |
10 |
0.000 |
1 |
0.000 |
|
|
|
|
|
|
|
|
|
|
|
| Shikimate pathway |
LitPath |
10 |
0.000 |
1 |
0.003 |
|
|
|
|
|
|
|
|
|
|
|
| Trp biosyntesis |
LitPath |
10 |
0.000 |
1 |
0.001 |
|
|
|
|
|
|
|
|
|
|
|
|
|
|
|
|
|
|
|
|
|
|
|
|
|
|
|
|
|
|
|
|
|
|
|
|
|
|
|
|
|
|
|
|
|
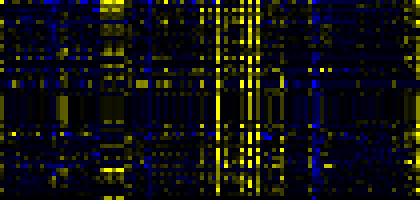
| Pathways co-expressed in the Stress data set ( with more than 10 annotation points) |
|
CYP81F2 (At5g57220) |
|
|
|
|
|
|
|
|
| max. difference between log2-ratios: |
12.0 |
|
|
|
|
|
|
|
|
|
|
|
|
| max. difference between log2-ratios excluding lowest and highest 5%: |
6.5 |
|
|
|
|
|
|
|
|
|
|
|
|
| Pathway |
Source |
Scores of Genes |
p[Score] |
No. of Genes |
p[genes] |
Link to stress heatmap |
|
|
|
|
|
|
|
| Phenylpropanoid Metabolism |
BioPath |
96 |
0.000 |
16 |
0.000 |
|
| Shikimate pathway |
LitPath |
82 |
0.000 |
11 |
0.000 |
| tryptophan biosynthesis |
TAIR-GO |
78 |
0.000 |
10 |
0.000 |
| Trp biosyntesis |
LitPath |
78 |
0.000 |
10 |
0.000 |
| Aromatic amino acid (Phe, Tyr, Trp) metabolism |
BioPath |
76 |
0.000 |
10 |
0.000 |
| tryptophan biosynthesis |
AraCyc |
68 |
0.000 |
9 |
0.000 |
| response to pathogenic bacteria |
TAIR-GO |
58 |
0.000 |
8 |
0.000 |
| Phenylalanine, tyrosine and tryptophan biosynthesis |
KEGG |
42 |
0.000 |
5 |
0.000 |
| Phenylpropanoid pathway |
LitPath |
26 |
0.036 |
7 |
0.024 |
| amino acid metabolism |
FunCat |
20 |
0.000 |
2 |
0.081 |
| de novo biosynthesis of purine nucleotides I |
AraCyc |
19 |
0.000 |
4 |
0.001 |
| Lipid signaling |
AcylLipid |
18 |
0.001 |
3 |
0.222 |
| Miscellaneous acyl lipid metabolism |
AcylLipid |
18 |
0.000 |
4 |
0.100 |
|
|
|
|
|
|
|
|
|
|
|
| defense response |
TAIR-GO |
17 |
0.000 |
2 |
0.007 |
|
|
|
|
|
|
|
|
|
|
|
| nucleotide metabolism |
TAIR-GO |
15 |
0.000 |
2 |
0.000 |
|
|
|
|
|
|
|
|
|
|
|
| Gluconeogenesis from lipids in seeds |
BioPath |
14 |
0.007 |
2 |
0.141 |
|
|
|
|
|
|
|
|
|
|
|
| lipases pathway |
AraCyc |
14 |
0.000 |
2 |
0.002 |
|
|
|
|
|
|
|
|
|
|
|
| lipid, fatty acid and isoprenoid degradation |
FunCat |
14 |
0.000 |
2 |
0.002 |
|
|
|
|
|
|
|
|
|
|
|
| Glycerophospholipid metabolism |
KEGG |
14 |
0.000 |
2 |
0.007 |
|
|
|
|
|
|
|
|
|
|
|
| toxin catabolism |
TAIR-GO |
12 |
0.000 |
2 |
0.058 |
|
|
|
|
|
|
|
|
|
|
|
| Alanine and aspartate metabolism |
KEGG |
12 |
0.000 |
2 |
0.016 |
|
|
|
|
|
|
|
|
|
|
|
| Benzoate degradation via CoA ligation |
KEGG |
12 |
0.006 |
6 |
0.001 |
|
|
|
|
|
|
|
|
|
|
|
| beta-Alanine metabolism |
KEGG |
12 |
0.000 |
2 |
0.005 |
|
|
|
|
|
|
|
|
|
|
|
| Butanoate metabolism |
KEGG |
12 |
0.000 |
2 |
0.009 |
|
|
|
|
|
|
|
|
|
|
|
| Glutamate metabolism |
KEGG |
12 |
0.001 |
2 |
0.037 |
|
|
|
|
|
|
|
|
|
|
|
| Glutathione metabolism |
KEGG |
12 |
0.000 |
2 |
0.035 |
|
|
|
|
|
|
|
|
|
|
|
| Inositol phosphate metabolism |
KEGG |
12 |
0.013 |
6 |
0.001 |
|
|
|
|
|
|
|
|
|
|
|
| Nicotinate and nicotinamide metabolism |
KEGG |
12 |
0.002 |
6 |
0.000 |
|
|
|
|
|
|
|
|
|
|
|
| Taurine and hypotaurine metabolism |
KEGG |
12 |
0.000 |
2 |
0.000 |
|
|
|
|
|
|
|
|
|
|
|
| disease, virulence and defense |
FunCat |
11 |
0.000 |
2 |
0.000 |
|
|
|
|
|
|
|
|
|
|
|
| Stilbene, coumarine and lignin biosynthesis |
KEGG |
11 |
0.013 |
2 |
0.242 |
|
|
|
|
|
|
|
|
|
|
|
|
|
|
|
|
|
|
|
|
|
|
|
|
|
|
|
|
|
|
|
|
|
|
|
|
|
|
|
|
|
|
|
|
|
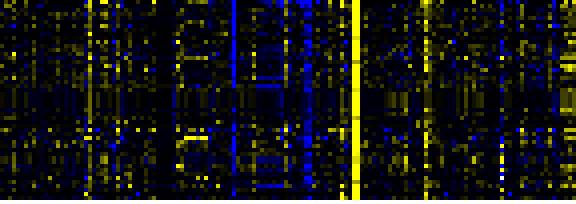
| Pathways co-expressed in the Hormone etc. data set (with more than 10 annotation points) |
|
CYP81F2 (At5g57220) |
|
|
|
|
|
|
|
|
| max. difference between log2-ratios: |
10.0 |
|
|
|
|
|
|
|
|
|
|
|
|
| max. difference between log2-ratios excluding lowest and highest 5%: |
5.6 |
|
|
|
|
|
|
|
|
|
|
|
|
| Pathway |
Source |
Scores of Genes |
p[Score] |
No. of Genes |
p[genes] |
Link to hormones etc. heatmap |
|
|
|
|
|
|
|
| Biosynthesis of Amino Acids and Derivatives |
BioPath |
62 |
0.000 |
8 |
0.001 |
|
|
|
|
|
|
| Phenylpropanoid Metabolism |
BioPath |
55 |
0.000 |
9 |
0.000 |
|
|
|
|
|
| tryptophan biosynthesis |
AraCyc |
50 |
0.000 |
8 |
0.000 |
|
|
|
|
|
| tryptophan biosynthesis |
TAIR-GO |
48 |
0.000 |
7 |
0.000 |
|
|
|
|
|
| Shikimate pathway |
LitPath |
48 |
0.000 |
7 |
0.000 |
|
|
|
|
|
| Trp biosyntesis |
LitPath |
48 |
0.000 |
7 |
0.000 |
|
|
|
|
|
| Glutathione metabolism |
BioPath |
46 |
0.000 |
5 |
0.000 |
|
|
|
|
|
| Aromatic amino acid (Phe, Tyr, Trp) metabolism |
BioPath |
42 |
0.000 |
6 |
0.000 |
|
|
|
|
|
| response to pathogenic bacteria |
TAIR-GO |
38 |
0.000 |
6 |
0.000 |
|
|
|
|
|
| sulfate assimilation III |
AraCyc |
36 |
0.000 |
4 |
0.000 |
|
|
|
|
|
| nitrogen and sulfur utilization |
FunCat |
29 |
0.000 |
3 |
0.000 |
|
|
|
|
|
| Glutamate metabolism |
KEGG |
28 |
0.000 |
4 |
0.001 |
|
|
|
|
|
| Phenylalanine, tyrosine and tryptophan biosynthesis |
KEGG |
22 |
0.000 |
3 |
0.005 |
|
|
|
|
|
|
|
|
|
|
|
| Chlorophyll biosynthesis and breakdown |
BioPath |
20 |
0.000 |
2 |
0.013 |
|
|
|
|
|
|
|
|
|
|
|
| Plastidial Isoprenoids (Chlorophylls, Carotenoids, Tocopherols, Plastoquinone, Phylloquinone) |
BioPath |
20 |
0.007 |
2 |
0.128 |
|
|
|
|
|
|
|
|
|
|
|
| biosynthesis of proto- and siroheme |
AraCyc |
20 |
0.000 |
2 |
0.024 |
|
|
|
|
|
|
|
|
|
|
|
| cysteine biosynthesis I |
AraCyc |
20 |
0.000 |
2 |
0.021 |
|
|
|
|
|
|
|
|
|
|
|
| biogenesis of chloroplast |
FunCat |
20 |
0.000 |
2 |
0.032 |
|
|
|
|
|
|
|
|
|
|
|
| Porphyrin and chlorophyll metabolism |
KEGG |
20 |
0.000 |
2 |
0.009 |
|
|
|
|
|
|
|
|
|
|
|
| Purine metabolism |
KEGG |
20 |
0.000 |
3 |
0.016 |
|
|
|
|
|
|
|
|
|
|
|
| Sulfur metabolism |
KEGG |
20 |
0.000 |
2 |
0.005 |
|
|
|
|
|
|
|
|
|
|
|
| chlorophyll and phytochromobilin metabolism |
LitPath |
20 |
0.001 |
2 |
0.086 |
|
|
|
|
|
|
|
|
|
|
|
| de novo biosynthesis of purine nucleotides I |
AraCyc |
19 |
0.000 |
4 |
0.010 |
|
|
|
|
|
|
|
|
|
|
|
| Nitrogen metabolism |
KEGG |
19 |
0.000 |
2 |
0.015 |
|
|
|
|
|
|
|
|
|
|
|
| Alanine and aspartate metabolism |
KEGG |
18 |
0.000 |
3 |
0.001 |
|
|
|
|
|
|
|
|
|
|
|
| dissimilatory sulfate reduction |
AraCyc |
16 |
0.000 |
2 |
0.000 |
|
|
|
|
|
|
|
|
|
|
|
| nucleotide metabolism |
TAIR-GO |
15 |
0.000 |
2 |
0.000 |
|
|
|
|
|
|
|
|
|
|
|
| toxin catabolism |
TAIR-GO |
14 |
0.000 |
3 |
0.011 |
|
|
|
|
|
|
|
|
|
|
|
| Carbon fixation |
KEGG |
14 |
0.008 |
3 |
0.021 |
|
|
|
|
|
|
|
|
|
|
|
| Lipid signaling |
AcylLipid |
14 |
0.000 |
4 |
0.026 |
|
|
|
|
|
|
|
|
|
|
|
| ethylene biosynthesis |
TAIR-GO |
13 |
0.000 |
2 |
0.000 |
|
|
|
|
|
|
|
|
|
|
|
| Benzoate degradation via CoA ligation |
KEGG |
13 |
0.017 |
3 |
0.057 |
|
|
|
|
|
|
|
|
|
|
|
| respiration |
FunCat |
12 |
0.000 |
2 |
0.001 |
|
|
|
|
|
|
|
|
|
|
|
| beta-Alanine metabolism |
KEGG |
12 |
0.000 |
2 |
0.004 |
|
|
|
|
|
|
|
|
|
|
|
| Butanoate metabolism |
KEGG |
12 |
0.000 |
2 |
0.008 |
|
|
|
|
|
|
|
|
|
|
|
| Taurine and hypotaurine metabolism |
KEGG |
12 |
0.000 |
2 |
0.000 |
|
|
|
|
|
|
|
|
|
|
|
| Flavonoid and anthocyanin metabolism |
BioPath |
11 |
0.000 |
2 |
0.049 |
|
|
|
|
|
|
|
|
|
|
|
|
|
|
|
|
|
|
|
|
|
|
|
|
|
|
|
|
|
|
|
|
|
|
|
|
|
|
|
|
|
|
|
|
|
|
|
|
|
|
|
|
|
|
|
|
|
|
|
|
|
|
| Pathways co-expressed in the Mutant data set (with more than 10 annotation points) |
|
CYP81F2 (At5g57220) |
|
|
|
|
|
|
|
|
| max. difference between log2-ratios: |
12.1 |
|
|
|
|
|
|
|
|
|
|
|
|
| max. difference between log2-ratios excluding lowest and highest 5%: |
5.0 |
|
|
|
|
|
|
|
|
|
|
|
|
| Pathway |
Source |
Scores of Genes |
p[Score] |
No. of Genes |
p[genes] |
Link to mutants heatmap |
|
|
|
|
|
|
|
| Phenylpropanoid Metabolism |
BioPath |
56 |
0.000 |
10 |
0.000 |
|
|
|
|
| response to pathogenic bacteria |
TAIR-GO |
44 |
0.000 |
6 |
0.000 |
|
|
|
| tryptophan biosynthesis |
TAIR-GO |
44 |
0.000 |
6 |
0.000 |
|
|
|
| tryptophan biosynthesis |
AraCyc |
44 |
0.000 |
6 |
0.000 |
|
|
|
| Shikimate pathway |
LitPath |
44 |
0.000 |
6 |
0.000 |
|
|
|
| Trp biosyntesis |
LitPath |
44 |
0.000 |
6 |
0.000 |
|
|
|
| Lipid signaling |
AcylLipid |
42 |
0.000 |
10 |
0.002 |
|
|
|
| Aromatic amino acid (Phe, Tyr, Trp) metabolism |
BioPath |
38 |
0.000 |
5 |
0.000 |
|
|
|
| response to wounding |
TAIR-GO |
36 |
0.000 |
6 |
0.000 |
|
|
|
| Phenylpropanoid pathway |
LitPath |
36 |
0.000 |
8 |
0.001 |
|
|
|
| Benzoate degradation via CoA ligation |
KEGG |
27 |
0.000 |
9 |
0.000 |
|
|
|
| Inositol phosphate metabolism |
KEGG |
27 |
0.000 |
9 |
0.000 |
|
|
|
| Nicotinate and nicotinamide metabolism |
KEGG |
27 |
0.000 |
9 |
0.000 |
|
|
|
|
|
|
|
|
|
|
|
| jasmonic acid biosynthesis |
TAIR-GO |
26 |
0.000 |
4 |
0.000 |
|
|
|
|
|
|
|
|
|
|
|
| jasmonic acid biosynthesis |
AraCyc |
26 |
0.000 |
4 |
0.000 |
|
|
|
|
|
|
|
|
|
|
|
| Phenylalanine, tyrosine and tryptophan biosynthesis |
KEGG |
22 |
0.000 |
3 |
0.006 |
|
|
|
|
|
|
|
|
|
|
|
| lignin biosynthesis |
AraCyc |
20 |
0.000 |
4 |
0.000 |
|
|
|
|
|
|
|
|
|
|
|
| core phenylpropanoid metabolism |
BioPath |
18 |
0.000 |
5 |
0.000 |
|
|
|
|
|
|
|
|
|
|
|
| lipoxygenase pathway |
AraCyc |
16 |
0.000 |
3 |
0.000 |
|
|
|
|
|
|
|
|
|
|
|
| Purine metabolism |
KEGG |
16 |
0.000 |
2 |
0.086 |
|
|
|
|
|
|
|
|
|
|
|
| Stilbene, coumarine and lignin biosynthesis |
KEGG |
15 |
0.000 |
4 |
0.028 |
|
|
|
|
|
|
|
|
|
|
|
| Glutathione metabolism |
BioPath |
12 |
0.011 |
2 |
0.084 |
|
|
|
|
|
|
|
|
|
|
|
| phospholipid biosynthesis II |
AraCyc |
12 |
0.000 |
2 |
0.001 |
|
|
|
|
|
|
|
|
|
|
|
| triacylglycerol degradation |
AraCyc |
12 |
0.000 |
2 |
0.018 |
|
|
|
|
|
|
|
|
|
|
|
| response to absence of light |
TAIR-GO |
11 |
0.000 |
2 |
0.000 |
|
|
|
|
|
|
|
|
|
|
|
|
|
|
|
|
|
|
|
|
|
|
|
|
|
|
|
|