
| Co-Expression Analysis of: | CYPedia Home | Institut de Biologie Moléculaire des Plantes (Home) | ||||||||||||
| CYP86C1 (At1g24540) | save all data as Tab Delimited Table | |||||||||||||
| _________________________________________ | ||||||||||||||
| Pathways co-expressed in the 2 data sets (with more than 6 annotation points each) | Find below a list of pathways that are co-expressed with the bait. First a list of pathways is given that are co-expressed in all data sets. Lists for each individual dataset are shown underneath. Depending on the number of co-expressed pathways only the top scoring pathways are given; all data can be saved as text using the link above. |
|
||||||||||||
| Pathway | Source | Sum of scores | Sum of genes | |||||||||||
| Cell Wall Carbohydrate Metabolism | BioPath | 26 | 7 | |||||||||||
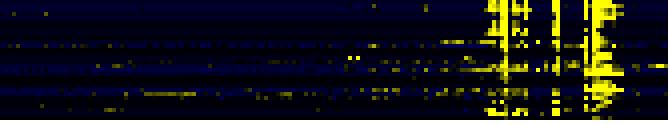
| To the right of each table a thumbnail of the actual co-expression heatmap is given. Klick on the link to see the heatmap containing all co-expressed genes. | ||||||||||||||
| For more information on how these pathway maps were generated please read the methods page | ||||||||||||||
| Pathways co-expressed in the Organ and Tissue data set (with more than 6 annotation points) | CYP86C1 (At1g24540) | |||||||||||||
| max. difference between log2-ratios: | 6.50 | |||||||||||||
| max. difference between log2-ratios excluding lowest and highest 5%: | 4.50 | |||||||||||||
| Pathway | Source | Scores of Genes | p[Score] | No. of Genes | p[genes] | Link to organ heatmap | ||||||||
| Flavonoid and anthocyanin metabolism | BioPath | 26 | 0.000 | 3 | 0.000 |
|
||||||||
| Phenylpropanoid Metabolism | BioPath | 26 | 0.000 | 3 | 0.026 | |||||||||
| Cell Wall Carbohydrate Metabolism | BioPath | 18 | 0.001 | 5 | 0.019 | |||||||||
| proanthocyanidin biosynthesis | TAIR-GO | 18 | 0.000 | 2 | 0.000 | |||||||||
| mono-/sesqui-/di-terpene biosynthesis | LitPath | 18 | 0.000 | 3 | 0.001 | |||||||||
| terpenoid metabolism | LitPath | 18 | 0.000 | 3 | 0.001 | |||||||||
| pectin metabolism | BioPath | 12 | 0.000 | 4 | 0.002 | |||||||||
| gibberellic acid biosynthesis | TAIR-GO | 10 | 0.000 | 1 | 0.000 | |||||||||
| anthocyanin biosynthesis | AraCyc | 10 | 0.000 | 1 | 0.000 | |||||||||
| gibberellin biosynthesis | AraCyc | 10 | 0.000 | 1 | 0.000 | |||||||||
| Diterpenoid biosynthesis | KEGG | 10 | 0.000 | 1 | 0.001 | |||||||||
| Miscellaneous acyl lipid metabolism | AcylLipid | 10 | 0.000 | 5 | 0.000 | |||||||||
| flavonoid, anthocyanin, and proanthocyanidin biosynthesis | LitPath | 10 | 0.000 | 1 | 0.010 | |||||||||
| Gibberellin metabolism | LitPath | 10 | 0.000 | 1 | 0.024 | |||||||||
| giberelin biosynthesis | LitPath | 10 | 0.000 | 1 | 0.014 | |||||||||
| proanthocyanidin biosynthesis | LitPath | 10 | 0.000 | 1 | 0.010 | |||||||||
| flavonoid biosynthesis | TAIR-GO | 8 | 0.000 | 1 | 0.000 | |||||||||
| mRNA synthesis | FunCat | 8 | 0.000 | 1 | 0.016 | |||||||||
| RNA synthesis | FunCat | 8 | 0.000 | 1 | 0.016 | |||||||||
| transcription | FunCat | 8 | 0.000 | 1 | 0.004 | |||||||||
| transcriptional control | FunCat | 8 | 0.000 | 1 | 0.003 | |||||||||
| Pathways co-expressed in the Stress data set (with more than 6 annotation points) | CYP86C1 (At1g24540) | |||||||||||||
| max. difference between log2-ratios: | 0.0 | |||||||||||||
| max. difference between log2-ratios excluding lowest and highest 5%: | 0.0 | |||||||||||||
| this gene is not detectably differentially expressed in this data set | ||||||||||||||
| Pathways co-expressed in the Hormone etc. data set (with more than 6 annotation points) | CYP86C1 (At1g24540) | |||||||||||||
| max. difference between log2-ratios: | 0.0 | |||||||||||||
| max. difference between log2-ratios excluding lowest and highest 5%: | 0.0 | |||||||||||||
| this gene is not detectably differentially expressed in this data set | ||||||||||||||
| Pathways co-expressed in the Mutant data set (with more than 10 annotation points) | CYP86C1 (At1g24540) | |||||||||||||
| max. difference between log2-ratios: | * | |||||||||||||
| max. difference between log2-ratios excluding lowest and highest 5%: | * | |||||||||||||
| Pathway | Source | Scores of Genes | p[Score] | No. of Genes | p[genes] | Link to mutants heatmap | ||||||||
| Cell Wall Carbohydrate Metabolism | BioPath | 8 | 0.000 | 2 | 0.007 | |||||||||
| page created by Juergen Ehlting | 03/06/06 | |||||||||||||