| Co-Expression Analysis of: | CYPedia Home | Institut de Biologie Moléculaire des Plantes (Home) | ||||||||||||||
| CYP93D1 (At5g06900) | save all data as Tab Delimited Table | |||||||||||||||
| Pathways co-expressed in all four data set (with more than 6 annotation points each) | ||||||||||||||||
| Pathway | Source | Sum of scores | Sum of genes | Find below a list of pathways that are co-expressed with the bait. First a list of pathways is given that are co-expressed in all four data sets. Lists for each individual dataset are shown underneath. To the right of each table a thumbnail of the actual co-expression heatmap is given. Klick on the link to see the heatmap containing all co-expressed genes. | ||||||||||||
| Phenylpropanoid Metabolism | BioPath | 31 | 4 | |||||||||||||
| Glucosyltransferases for benzoic acids | BioPath | 30 | 3 | |||||||||||||
| flavonol biosynthesis | AraCyc | 20 | 2 | |||||||||||||
| For more information on how these pathway maps were generated please read the methods page | ||||||||||||||||
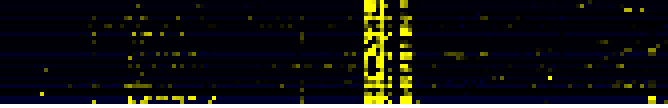
| Pathways co-expressed in the Organ and Tissue data set (with more than 6 annotation points) | CYP93D1 (At5g06900) | |||||||||||||||
| max. difference between log2-ratios: | 4.27 | |||||||||||||||
| max. difference between log2-ratios excluding lowest and highest 5%: | 0.00 | |||||||||||||||
| Pathway | Source | Scores of Genes | p[Score] | No. of Genes | p[genes] | Link to organ heatmap | ||||||||||
| Phenylpropanoid Metabolism | BioPath | 21 | 0.000 | 3 | 0.013 |
|
||||||||||
| Glucosyltransferases for benzoic acids | BioPath | 20 | 0.000 | 2 | 0.000 | |||||||||||
| flavonol biosynthesis | AraCyc | 10 | 0.000 | 1 | 0.000 | |||||||||||
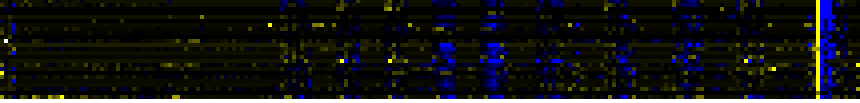
| Pathways co-expressed in the Stress data set ( with more than 8 annotation points) | CYP93D1 (At5g06900) | |||||||||||||||
| max. difference between log2-ratios: | 8.23 | |||||||||||||||
| max. difference between log2-ratios excluding lowest and highest 5%: | 1.70 | |||||||||||||||
| Pathway | Source | Scores of Genes | p[Score] | No. of Genes | p[genes] | |||||||||||
| Cell Wall Carbohydrate Metabolism | BioPath | 22 | 0.000 | 5 | 0.010 | Link to stress heatmap | ||||||||||
| Intermediary Carbon Metabolism | BioPath | 14 | 0.000 | 2 | 0.065 |
|
||||||||||
| Fructose and mannose metabolism | KEGG | 14 | 0.000 | 2 | 0.005 | |||||||||||
| GDP-carbohydrate biosynthesis | BioPath | 10 | 0.000 | 1 | 0.001 | |||||||||||
| Glucosyltransferases for benzoic acids | BioPath | 10 | 0.000 | 1 | 0.003 | |||||||||||
| Phenylpropanoid Metabolism | BioPath | 10 | 0.033 | 1 | 0.278 | |||||||||||
| acetyl-CoA assimilation | AraCyc | 10 | 0.000 | 1 | 0.017 | |||||||||||
| colanic acid building blocks biosynthesis | AraCyc | 10 | 0.000 | 1 | 0.047 | |||||||||||
| dTDP-rhamnose biosynthesis | AraCyc | 10 | 0.000 | 1 | 0.029 | |||||||||||
| flavonol biosynthesis | AraCyc | 10 | 0.000 | 1 | 0.007 | |||||||||||
| galactose degradation I | AraCyc | 10 | 0.000 | 1 | 0.001 | |||||||||||
| glucose conversion | AraCyc | 10 | 0.000 | 1 | 0.025 | |||||||||||
| glyoxylate cycle | AraCyc | 10 | 0.000 | 1 | 0.009 | |||||||||||
| lactose degradation IV | AraCyc | 10 | 0.000 | 1 | 0.001 | |||||||||||
| leucine biosynthesis | AraCyc | 10 | 0.000 | 1 | 0.004 | |||||||||||
| serine-isocitrate lyase pathway | AraCyc | 10 | 0.000 | 1 | 0.032 | |||||||||||
| TCA cycle -- aerobic respiration | AraCyc | 10 | 0.000 | 1 | 0.034 | |||||||||||
| TCA cycle variation VII | AraCyc | 10 | 0.000 | 1 | 0.070 | |||||||||||
| TCA cycle variation VIII | AraCyc | 10 | 0.000 | 1 | 0.037 | |||||||||||
| UDP-glucose conversion | AraCyc | 10 | 0.000 | 1 | 0.024 | |||||||||||
| C-compound and carbohydrate glyoxylate cycle | FunCat | 10 | 0.000 | 1 | 0.000 | |||||||||||
| glyoxylate cycle | FunCat | 10 | 0.000 | 1 | 0.000 | |||||||||||
| isoprenoid biosynthesis | FunCat | 10 | 0.000 | 2 | 0.004 | |||||||||||
| lipid, fatty acid and isoprenoid biosynthesis | FunCat | 10 | 0.000 | 2 | 0.003 | |||||||||||
| tricarboxylic-acid pathway (citrate cycle, Krebs cycle, TCA cycle) | FunCat | 10 | 0.001 | 1 | 0.103 | |||||||||||
| Citrate cycle (TCA cycle) | KEGG | 10 | 0.000 | 1 | 0.039 | |||||||||||
| Glyoxylate and dicarboxylate metabolism | KEGG | 10 | 0.000 | 1 | 0.019 | |||||||||||
| Reductive carboxylate cycle (CO2 fixation) | KEGG | 10 | 0.000 | 1 | 0.010 | |||||||||||
| Pathways co-expressed in the Hormone etc. data set (with more than 10 annotation points) | CYP93D1 (At5g06900) | |||||||||||||||
| max. difference between log2-ratios: | 2.53 | |||||||||||||||
| max. difference between log2-ratios excluding lowest and highest 5%: | 0.02 | |||||||||||||||
| there are no genes co-expressed with the bait with anotation score >6 | Link to hormones etc. heatmap | |||||||||||||||
| Pathways co-expressed in the Mutant data set | CYP93D1 (At5g06900) | |||||||||||||||
| max. difference between log2-ratios: | * | |||||||||||||||
| max. difference between log2-ratios excluding lowest and highest 5%: | * | |||||||||||||||
| there are no genes co-expressed with the bait with annotation score >6 | Link to mutants heatmap | |||||||||||||||