
| Co-Expression Analysis of: | CYPedia Home | Institut de Biologie Moléculaire des Plantes (Home) | ||||||||||||||
| CYP705A30 (At3g20940) | save all data as Tab Delimited Table | |||||||||||||||
| _________________________________________ |
|
|||||||||||||||
| Pathways co-expressed in the 2 data sets with co-expressed pathways (with more than 6 annotation points each) | Find below a list of pathways that are co-expressed with the bait. First a list of pathways is given that are co-expressed in all data sets. Lists for each individual dataset are shown underneath. Depending on the number of co-expressed pathways only the top scoring pathways are given; all data can be saved as text using the link above. | |||||||||||||||
| there are no co-expressed pathways common in the 2 data sets | ||||||||||||||||
| To the right of each table a thumbnail of the actual co-expression heatmap is given. Klick on the link to see the heatmap containing all co-expressed genes. | ||||||||||||||||
| For more information on how these pathway maps were generated please read the methods page | ||||||||||||||||
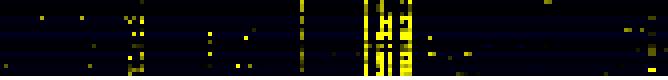
| Pathways co-expressed in the Organ and Tissue data set (with more than 6 annotation points) | CYP705A30 (At3g20940) | |||||||||||||||
| max. difference between log2-ratios: | 3.7 | |||||||||||||||
| max. difference between log2-ratios excluding lowest and highest 5%: | 0.0 | |||||||||||||||
| Pathway | Source | Scores of Genes | p[Score] | No. of Genes | p[genes] | Link to organ heatmap | ||||||||||
| Biosynthesis of steroids | KEGG | 21 | 0.000 | 3 | 0.000 |
|
||||||||||
| Biosynthesis of prenyl diphosphates | BioPath | 14 | 0.000 | 2 | 0.001 | |||||||||||
| Terpenoid biosynthesis | KEGG | 14 | 0.000 | 2 | 0.000 | |||||||||||
| prenyl diphosphate (GPP,FPP, GGPP) biosynthesis | LitPath | 14 | 0.000 | 2 | 0.002 | |||||||||||
| triterpene, sterol, and brassinosteroid metabolism | LitPath | 11 | 0.001 | 3 | 0.023 | |||||||||||
| Isoprenoid Biosynthesis in the Cytosol and in Mitochondria | BioPath | 10 | 0.000 | 1 | 0.031 | |||||||||||
| mono-/sesqui-/di-terpene biosynthesis | LitPath | 8 | 0.000 | 2 | 0.014 | |||||||||||
| terpenoid metabolism | LitPath | 8 | 0.000 | 2 | 0.016 | |||||||||||
| pentacyclic triterpenoid biosynthesis | TAIR-GO | 7 | 0.000 | 1 | 0.000 | |||||||||||
| secondary metabolism | FunCat | 7 | 0.000 | 1 | 0.000 | |||||||||||
| triterpene biosynthesis | LitPath | 7 | 0.000 | 1 | 0.012 | |||||||||||
| pectin metabolism | BioPath | 6.5 | 0.001 | 2 | 0.026 | |||||||||||
| Pathways co-expressed in the Stress data set ( with more than 6 annotation points) | CYP705A30 (At3g20940) | |||||||||||||||
| max. difference between log2-ratios: | 3.5 | |||||||||||||||
| max. difference between log2-ratios excluding lowest and highest 5%: | 0.0 | |||||||||||||||
| Link to stress heatmap | ||||||||||||||||
| there are no co-expressed genes with r>0.5 | ||||||||||||||||
| Pathways co-expressed in the Hormone etc. data set (with more than 6 annotation points) | CYP705A30 (At3g20940) | |||||||||||||||
| max. difference between log2-ratios: | 5.7 | |||||||||||||||
| max. difference between log2-ratios excluding lowest and highest 5%: | 1.1 | |||||||||||||||
| Link to hormones etc. heatmap | ||||||||||||||||
| there are no co-expressed genes with more than 6 annotation points | ||||||||||||||||
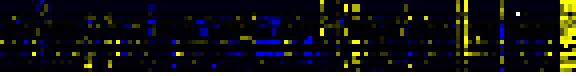
| Pathways co-expressed in the Mutant data set (with more than 6 annotation points) | CYP705A30 (At3g20940) | |||||||||||||||
| max. difference between log2-ratios: | 7.6 | |||||||||||||||
| max. difference between log2-ratios excluding lowest and highest 5%: | 1.2 | |||||||||||||||
| Pathway | Source | Scores of Genes | p[Score] | No. of Genes | p[genes] | Link to mutants heatmap | ||||||||||
| Leaf Glycerolipid Biosynthesis | BioPath | 8 | 0.000 | 2 | 0.017 |
|
||||||||||
| Leaf Glycerolipid Biosynthesis in Plastid | BioPath | 8 | 0.000 | 2 | 0.001 | |||||||||||
| Synthesis of fatty acids in plastids | AcylLipid | 8 | 0.000 | 2 | 0.000 | |||||||||||
| page created by Juergen Ehlting | 06/05/06 | |||||||||||||||