|
|
|
|
|
|
|
|
|
|
|
|
|
|
|
|
|
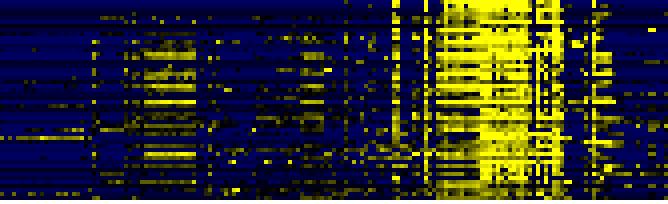
| Pathways co-expressed in the Organ and Tissue data set (with more than 9 annotation points) |
|
CYP706A3 (At5g44620) |
|
|
|
|
|
|
|
|
| max. difference between log2-ratios: |
7.5 |
|
|
|
|
|
|
|
|
|
|
|
|
| max. difference between log2-ratios excluding lowest and highest 5%: |
6.6 |
|
|
|
|
|
|
|
|
|
|
|
|
| Pathway |
Source |
Scores of Genes |
p[Score] |
No. of Genes |
p[genes] |
Link to organ heatmap |
|
|
|
|
|
|
|
| Cell Wall Carbohydrate Metabolism |
BioPath |
31 |
0.000 |
8 |
0.001 |
|
|
|
| Miscellaneous acyl lipid metabolism |
AcylLipid |
26 |
0.000 |
4 |
0.197 |
|
|
| Fatty acid elongation and wax and cutin metabolism |
AcylLipid |
24 |
0.000 |
5 |
0.001 |
|
|
| Gluconeogenesis from lipids in seeds |
BioPath |
20 |
0.000 |
2 |
0.020 |
|
|
| cellulose biosynthesis |
AraCyc |
20 |
0.000 |
5 |
0.000 |
|
|
| fatty acid oxidation pathway |
AraCyc |
20 |
0.000 |
2 |
0.000 |
|
|
| octane oxidation |
AraCyc |
20 |
0.000 |
2 |
0.000 |
|
|
| fatty acid metabolism |
TAIR-GO |
18 |
0.000 |
2 |
0.000 |
|
|
| pectin metabolism |
BioPath |
14 |
0.000 |
6 |
0.000 |
|
|
| Benzoate degradation via CoA ligation |
KEGG |
11.5 |
0.000 |
2 |
0.004 |
|
|
| Inositol phosphate metabolism |
KEGG |
11.5 |
0.000 |
2 |
0.005 |
|
|
| Nicotinate and nicotinamide metabolism |
KEGG |
11.5 |
0.000 |
2 |
0.003 |
|
|
| Synthesis of membrane lipids in endomembrane system |
AcylLipid |
11 |
0.036 |
3 |
0.022 |
|
|
|
|
|
|
|
|
|
|
|
| cutin biosynthesis |
TAIR-GO |
10 |
0.000 |
1 |
0.000 |
|
|
|
|
|
|
|
|
|
|
|
| fatty acid biosynthesis |
TAIR-GO |
10 |
0.000 |
1 |
0.003 |
|
|
|
|
|
|
|
|
|
|
|
| Fatty acid metabolism |
KEGG |
10 |
0.000 |
1 |
0.007 |
|
|
|
|
|
|
|
|
|
|
|
| mono-/sesqui-/di-terpene biosynthesis |
LitPath |
10 |
0.000 |
1 |
0.019 |
|
|
|
|
|
|
|
|
|
|
|
| sequiterpene biosynthesis |
LitPath |
10 |
0.000 |
1 |
0.000 |
|
|
|
|
|
|
|
|
|
|
|
| terpenoid metabolism |
LitPath |
10 |
0.000 |
1 |
0.020 |
|
|
|
|
|
|
|
|
|
|
|
|
|
|
|
|
|
|
|
|
|
|
|
|
|
|
|
|
|
|
|
|
|
|
|
|
|
|
|
|
|
|
|
|
|
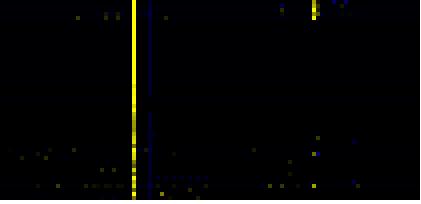
| Pathways co-expressed in the Hormone etc. data set (with more than 9 annotation points) |
|
CYP706A3 (At5g44620) |
|
|
|
|
|
|
|
|
| max. difference between log2-ratios: |
5.7 |
|
|
|
|
|
|
|
|
|
|
|
|
| max. difference between log2-ratios excluding lowest and highest 5%: |
0.0 |
|
|
|
|
|
|
|
|
|
|
|
|
| Pathway |
Source |
Scores of Genes |
p[Score] |
No. of Genes |
p[genes] |
Link to hormones etc. heatmap |
|
|
|
|
|
|
|
| Cell Wall Carbohydrate Metabolism |
BioPath |
105 |
0.000 |
26 |
0.000 |
|
|
|
|
|
|
| pectin metabolism |
BioPath |
75 |
0.000 |
21 |
0.000 |
|
|
|
|
|
| mono-/sesqui-/di-terpene biosynthesis |
LitPath |
54 |
0.000 |
6 |
0.000 |
|
|
|
|
|
| terpenoid metabolism |
LitPath |
54 |
0.000 |
6 |
0.000 |
|
|
|
|
|
| Miscellaneous acyl lipid metabolism |
AcylLipid |
48 |
0.000 |
18 |
0.000 |
|
|
|
|
|
| Starch and sucrose metabolism |
KEGG |
42 |
0.000 |
6 |
0.000 |
|
|
|
|
|
| Fatty acid elongation and wax and cutin metabolism |
AcylLipid |
21 |
0.000 |
6 |
0.026 |
|
|
|
|
|
| sexual reproduction |
TAIR-GO |
20 |
0.000 |
5 |
0.000 |
|
|
|
|
|
| monoterpene biosynthesis |
LitPath |
20 |
0.000 |
2 |
0.000 |
|
|
|
|
|
| sucrose metabolism |
BioPath |
16 |
0.000 |
2 |
0.006 |
|
|
|
|
|
| biogenesis of cell wall |
FunCat |
16 |
0.000 |
7 |
0.000 |
|
|
|
|
|
| Galactose metabolism |
KEGG |
16 |
0.000 |
2 |
0.003 |
|
|
|
|
|
| C-compound and carbohydrate utilization |
FunCat |
14 |
0.000 |
2 |
0.000 |
|
|
|
|
|
|
|
|
|
|
|
| fatty acid metabolism |
TAIR-GO |
13 |
0.000 |
2 |
0.003 |
|
|
|
|
|
|
|
|
|
|
|
| Oxidative phosphorylation |
KEGG |
12 |
0.000 |
3 |
0.006 |
|
|
|
|
|
|
|
|
|
|
|
| jasmonic acid biosynthesis |
TAIR-GO |
10 |
0.000 |
1 |
0.020 |
|
|
|
|
|
|
|
|
|
|
|
| jasmonic acid mediated signaling pathway |
TAIR-GO |
10 |
0.000 |
1 |
0.000 |
|
|
|
|
|
|
|
|
|
|
|
| jasmonic acid metabolism |
TAIR-GO |
10 |
0.000 |
1 |
0.000 |
|
|
|
|
|
|
|
|
|
|
|
| monoterpenoid biosynthesis |
TAIR-GO |
10 |
0.000 |
1 |
0.001 |
|
|
|
|
|
|
|
|
|
|
|
| N-terminal protein myristoylation |
TAIR-GO |
10 |
0.000 |
1 |
0.007 |
|
|
|
|
|
|
|
|
|
|
|
| pentacyclic triterpenoid biosynthesis |
TAIR-GO |
10 |
0.000 |
1 |
0.004 |
|
|
|
|
|
|
|
|
|
|
|
| response to wounding |
TAIR-GO |
10 |
0.000 |
1 |
0.026 |
|
|
|
|
|
|
|
|
|
|
|
| jasmonic acid biosynthesis |
AraCyc |
10 |
0.000 |
1 |
0.003 |
|
|
|
|
|
|
|
|
|
|
|
| monoterpene biosynthesis |
AraCyc |
10 |
0.000 |
1 |
0.000 |
|
|
|
|
|
|
|
|
|
|
|
| plant monoterpene biosynthesis |
AraCyc |
10 |
0.000 |
1 |
0.000 |
|
|
|
|
|
|
|
|
|
|
|
| C-compound, carbohydrate catabolism |
FunCat |
10 |
0.000 |
3 |
0.005 |
|
|
|
|
|
|
|
|
|
|
|
| Biosynthesis of steroids |
KEGG |
10 |
0.000 |
1 |
0.077 |
|
|
|
|
|
|
|
|
|
|
|
| sequiterpene biosynthesis |
LitPath |
10 |
0.000 |
1 |
0.001 |
|
|
|
|
|
|
|
|
|
|
|
| triterpene biosynthesis |
LitPath |
10 |
0.000 |
1 |
0.032 |
|
|
|
|
|
|
|
|
|
|
|
|
|
|
|
|
|
|
|
|
|
|
|
|
|
|
|
|