|
|
|
|
|
|
|
|
|
|
|
|
|
|
|
|
|
| Pathways co-expressed in the 3 applicable data sets (with more than 6 annotation points each) |
|
|
|
|
|
|
|
|
|
|
|
|
|
| Pathway |
Source |
Sum of scores |
Sum of genes |
|
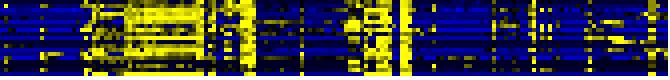
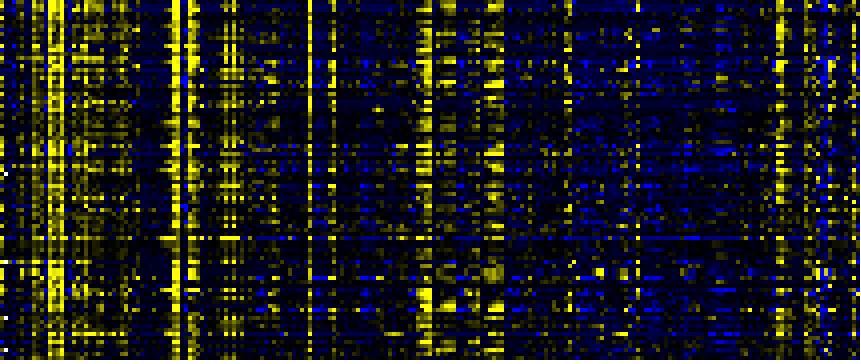
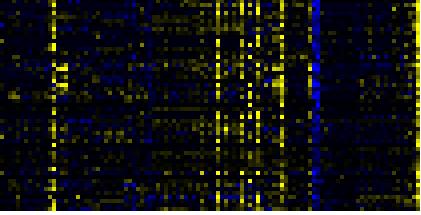
Find below a list of pathways that are co-expressed with the bait. First a list of pathways is given that are co-expressed in all four data sets. Lists for each individual dataset are shown underneath. To the right of each table a thumbnail of the actual co-expression heatmap is given. Klick on the link to see the heatmap containing all co-expressed genes. |
|
|
|
|
|
|
|
|
|
| Phenylpropanoid Metabolism |
BioPath |
105 |
18 |
|
|
|
|
|
|
|
|
|
|
| sucrose metabolism |
BioPath |
50 |
9 |
|
|
|
|
|
|
|
|
|
|
| Starch and sucrose metabolism |
KEGG |
50 |
9 |
|
|
|
|
|
|
|
|
|
|
| Prostaglandin and leukotriene metabolism |
KEGG |
48 |
12 |
|
|
|
|
|
|
|
|
|
|
| toxin catabolism |
TAIR-GO |
42 |
17 |
|
For more information on how these pathway maps were generated please read the methods page |
|
|
|
|
|
|
|
|
|
| Stilbene, coumarine and lignin biosynthesis |
KEGG |
40 |
11 |
|
|
|
|
|
|
|
|
|
|
| Phenylalanine metabolism |
KEGG |
40 |
12 |
|
|
|
|
|
|
|
|
|
|
|
|
|
| Glucosyltransferases for benzoic acids |
BioPath |
30 |
3 |
|
|
|
|
|
|
|
|
|
|
|
|
|
|
|
|
|
|
|
|
|
|
|
|
|
|
|
|
|
|
|
|
|
|
|
|
|
|
|
|
|
|
|
|
|
|
|
|
|
|
|
|
|
|
|
|
|
|
|
|
|
|
|
|
|
|
|
|
|
|
|
|
|
|
|
|
|
|
|
|
|
| Pathways co-expressed in the Organ and Tissue data set (with more than 6 annotation points) |
|
CYP710A1 (At2g34500) |
|
|
|
|
|
|
|
|
| max. difference between log2-ratios: |
4.9 |
|
|
|
|
|
|
|
|
|
|
|
|
| max. difference between log2-ratios excluding lowest and highest 5%: |
3.3 |
|
|
|
|
|
|
|
|
|
|
|
|
| Pathway |
Source |
Scores of Genes |
p[Score] |
No. of Genes |
p[genes] |
Link to organ heatmap |
|
|
|
|
|
|
|
| Phenylpropanoid Metabolism |
BioPath |
14 |
0.000 |
2 |
0.005 |
|
|
|
|
| Cell Wall Carbohydrate Metabolism |
BioPath |
10 |
0.005 |
1 |
0.168 |
|
|
|
| Glucosyltransferases for benzoic acids |
BioPath |
10 |
0.000 |
1 |
0.000 |
|
|
|
| sucrose metabolism |
BioPath |
10 |
0.000 |
1 |
0.001 |
|
|
|
| cell death |
TAIR-GO |
10 |
0.000 |
1 |
0.000 |
|
|
|
| fatty acid alpha-oxidation |
TAIR-GO |
10 |
0.000 |
1 |
0.000 |
|
|
|
|
|
|
|
|
|
|
|
| toxin catabolism |
TAIR-GO |
10 |
0.000 |
5 |
0.000 |
|
|
|
|
|
|
|
|
|
|
|
| jasmonic acid biosynthesis |
AraCyc |
10 |
0.000 |
1 |
0.000 |
|
|
|
|
|
|
|
|
|
|
|
| lipoxygenase pathway |
AraCyc |
10 |
0.000 |
1 |
0.000 |
|
|
|
|
|
|
|
|
|
|
|
| C-compound and carbohydrate metabolism |
FunCat |
10 |
0.000 |
1 |
0.060 |
|
|
|
|
|
|
|
|
|
|
|
| glycolysis and gluconeogenesis |
FunCat |
10 |
0.000 |
1 |
0.013 |
|
|
|
|
|
|
|
|
|
|
|
| Galactose metabolism |
KEGG |
10 |
0.000 |
1 |
0.011 |
|
|
|
|
|
|
|
|
|
|
|
| Starch and sucrose metabolism |
KEGG |
10 |
0.000 |
1 |
0.056 |
|
|
|
|
|
|
|
|
|
|
|
| Lipid signaling |
AcylLipid |
10 |
0.000 |
1 |
0.155 |
|
|
|
|
|
|
|
|
|
|
|
| Methane metabolism |
KEGG |
8 |
0.000 |
4 |
0.000 |
|
|
|
|
|
|
|
|
|
|
|
| Phenylalanine metabolism |
KEGG |
8 |
0.000 |
4 |
0.000 |
|
|
|
|
|
|
|
|
|
|
|
| Prostaglandin and leukotriene metabolism |
KEGG |
8 |
0.000 |
4 |
0.000 |
|
|
|
|
|
|
|
|
|
|
|
| Stilbene, coumarine and lignin biosynthesis |
KEGG |
8 |
0.000 |
4 |
0.000 |
|
|
|
|
|
|
|
|
|
|
|
|
|
|
|
|
|
|
|
|
|
|
|
|
|
|
|
|
|
|
|
|
|
|
|
|
|
|
|
|
|
|
|
|
|
| Pathways co-expressed in the Stress data set ( with more than 20 annotation points) |
|
CYP710A1 (At2g34500) |
|
|
|
|
|
|
|
|
| max. difference between log2-ratios: |
8.3 |
|
|
|
|
|
|
|
|
|
|
|
|
| max. difference between log2-ratios excluding lowest and highest 5%: |
3.7 |
|
|
|
|
|
|
|
|
|
|
|
|
| Pathway |
Source |
Scores of Genes |
p[Score] |
No. of Genes |
p[genes] |
|
|
|
|
|
|
|
|
|
|
|
| Phenylpropanoid Metabolism |
BioPath |
74 |
0.000 |
12 |
0.002 |
Link to stress heatmap |
|
|
|
|
|
|
|
| Intermediary Carbon Metabolism |
BioPath |
68 |
0.000 |
15 |
0.000 |
|
| Gluconeogenesis from lipids in seeds |
BioPath |
61 |
0.000 |
9 |
0.000 |
| C-compound and carbohydrate metabolism |
FunCat |
61 |
0.000 |
15 |
0.011 |
| Biosynthesis of Amino Acids and Derivatives |
BioPath |
60 |
0.000 |
6 |
0.232 |
| amino acid metabolism |
FunCat |
49 |
0.000 |
6 |
0.052 |
| Phenylpropanoid pathway |
LitPath |
44 |
0.000 |
8 |
0.000 |
| Degradation of storage lipids and straight fatty acids |
AcylLipid |
41 |
0.000 |
6 |
0.001 |
| Citrate cycle (TCA cycle) |
KEGG |
36 |
0.000 |
8 |
0.000 |
| core phenylpropanoid metabolism |
BioPath |
34 |
0.000 |
5 |
0.002 |
| Glutathione metabolism |
KEGG |
34 |
0.000 |
6 |
0.001 |
| lignin biosynthesis |
AraCyc |
32 |
0.000 |
6 |
0.001 |
| Fatty acid metabolism |
KEGG |
32 |
0.000 |
4 |
0.008 |
| Glutamate metabolism |
KEGG |
32 |
0.000 |
4 |
0.021 |
| fatty acid beta oxidation complex |
BioPath |
29 |
0.000 |
4 |
0.000 |
| Arginine and proline metabolism |
KEGG |
29 |
0.000 |
3 |
0.069 |
| pentose-phosphate pathway |
FunCat |
26 |
0.000 |
5 |
0.000 |
| tricarboxylic-acid pathway (citrate cycle, Krebs cycle, TCA cycle) |
FunCat |
26 |
0.007 |
7 |
0.017 |
| Cysteine metabolism |
KEGG |
26 |
0.000 |
4 |
0.003 |
| Nucleotide Metabolism |
KEGG |
26 |
0.002 |
4 |
0.152 |
| Stilbene, coumarine and lignin biosynthesis |
KEGG |
25 |
0.002 |
6 |
0.074 |
| toxin catabolism |
TAIR-GO |
24 |
0.000 |
8 |
0.000 |
| mixed acid fermentation |
AraCyc |
22 |
0.000 |
4 |
0.006 |
| oxidative branch of the pentose phosphate pathway |
AraCyc |
22 |
0.000 |
4 |
0.000 |
|
|
|
|
|
|
|
|
|
|
|
| lipid, fatty acid and isoprenoid degradation |
FunCat |
22 |
0.000 |
3 |
0.011 |
|
|
|
|
|
|
|
|
|
|
|
| Alanine and aspartate metabolism |
KEGG |
22 |
0.000 |
3 |
0.027 |
|
|
|
|
|
|
|
|
|
|
|
| Carbon fixation |
KEGG |
22 |
0.019 |
4 |
0.093 |
|
|
|
|
|
|
|
|
|
|
|
| Pentose phosphate pathway |
KEGG |
22 |
0.000 |
4 |
0.017 |
|
|
|
|
|
|
|
|
|
|
|
|
|
|
|
|
|
|
|
|
|
|
|
|
|
|
|
|
|
|
|
|
|
|
|
|
|
|
|
|
|
|
|
|
|
| Pathways co-expressed in the Hormone etc. data set (with more than 9 annotation points) |
|
CYP710A1 (At2g34500) |
|
|
|
|
|
|
|
|
| max. difference between log2-ratios: |
9.0 |
|
|
|
|
|
|
|
|
|
|
|
|
| max. difference between log2-ratios excluding lowest and highest 5%: |
1.8 |
|
|
|
|
|
|
|
|
|
|
|
|
| Pathway |
Source |
Scores of Genes |
p[Score] |
No. of Genes |
p[genes] |
|
|
|
|
|
|
|
|
|
|
|
| Plastidial Isoprenoids (Chlorophylls, Carotenoids, Tocopherols, Plastoquinone, Phylloquinone) |
BioPath |
20 |
0.000 |
2 |
0.030 |
Link to hormones etc. heatmap |
|
|
|
|
|
|
|
| carotenoid biosynthesis |
TAIR-GO |
20 |
0.000 |
2 |
0.000 |
|
|
|
|
|
|
|
| Arginine and proline metabolism |
KEGG |
18 |
0.000 |
3 |
0.001 |
|
|
|
|
|
|
| Phenylpropanoid Metabolism |
BioPath |
17 |
0.000 |
4 |
0.012 |
|
|
|
|
|
|
| arginine degradation II |
AraCyc |
16 |
0.000 |
2 |
0.002 |
|
|
|
|
|
|
| arginine degradation III |
AraCyc |
16 |
0.000 |
2 |
0.000 |
|
|
|
|
|
|
| arginine degradation V |
AraCyc |
16 |
0.000 |
2 |
0.001 |
|
|
|
|
|
|
| Miscellaneous acyl lipid metabolism |
AcylLipid |
16 |
0.000 |
3 |
0.048 |
|
|
|
|
|
|
| Phenylalanine metabolism |
KEGG |
14 |
0.000 |
3 |
0.012 |
|
|
|
|
|
|
| Tyrosine metabolism |
KEGG |
14 |
0.000 |
3 |
0.001 |
|
|
|
|
|
|
| Gluconeogenesis from lipids in seeds |
BioPath |
12 |
0.000 |
2 |
0.018 |
|
|
|
|
|
|
| phenylalanine degradation I |
AraCyc |
12 |
0.000 |
2 |
0.006 |
|
|
|
|
|
|
| tyrosine degradation |
AraCyc |
12 |
0.000 |
2 |
0.000 |
|
|
|
|
|
|
| Benzoate degradation via CoA ligation |
KEGG |
11 |
0.000 |
2 |
0.062 |
|
|
|
|
|
|
| Glucosyltransferases for benzoic acids |
BioPath |
10 |
0.000 |
1 |
0.005 |
|
|
|
|
|
|
|
|
|
|
|
| Regulatory enzymes |
BioPath |
10 |
0.000 |
1 |
0.000 |
|
|
|
|
|
|
|
|
|
|
|
| Tocopherol biosynthesis |
BioPath |
10 |
0.000 |
1 |
0.001 |
|
|
|
|
|
|
|
|
|
|
|
| plastid organization and biogenesis |
TAIR-GO |
10 |
0.000 |
1 |
0.001 |
|
|
|
|
|
|
|
|
|
|
|
| plastoquinone biosynthesis |
TAIR-GO |
10 |
0.000 |
1 |
0.000 |
|
|
|
|
|
|
|
|
|
|
|
| response to high light intensity |
TAIR-GO |
10 |
0.000 |
1 |
0.001 |
|
|
|
|
|
|
|
|
|
|
|
| response to temperature |
TAIR-GO |
10 |
0.000 |
1 |
0.001 |
|
|
|
|
|
|
|
|
|
|
|
| vitamin E biosynthesis |
TAIR-GO |
10 |
0.000 |
1 |
0.001 |
|
|
|
|
|
|
|
|
|
|
|
| fatty acid oxidation pathway |
AraCyc |
10 |
0.000 |
1 |
0.028 |
|
|
|
|
|
|
|
|
|
|
|
| octane oxidation |
AraCyc |
10 |
0.000 |
1 |
0.008 |
|
|
|
|
|
|
|
|
|
|
|
| plastoquinone biosynthesis |
AraCyc |
10 |
0.000 |
1 |
0.001 |
|
|
|
|
|
|
|
|
|
|
|
| vitamin E biosynthesis |
AraCyc |
10 |
0.000 |
1 |
0.004 |
|
|
|
|
|
|
|
|
|
|
|
| C-compound and carbohydrate utilization |
FunCat |
10 |
0.000 |
1 |
0.000 |
|
|
|
|
|
|
|
|
|
|
|
| Fatty acid metabolism |
KEGG |
10 |
0.000 |
1 |
0.047 |
|
|
|
|
|
|
|
|
|
|
|
| Accessory protein/regulatory protein |
LitPath |
10 |
0.000 |
1 |
0.000 |
|
|
|
|
|
|
|
|
|
|
|
|
|
|
|
|
|
|
|
|
|
|
|
|
|
|
|
|