|
|
|
|
|
|
|
|
|
|
|
|
|
|
|
|
|
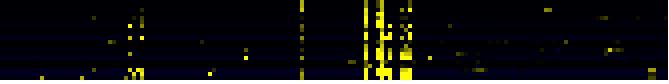
| Pathways co-expressed in the Organ and Tissue data set (with more than 6 annotation points) |
|
CYP710A3 / CYP710A4 (At2g28850 / At2g28860) |
|
|
|
|
|
|
|
|
| max. difference between log2-ratios: |
2.3 |
|
|
|
|
|
|
|
|
|
|
|
|
| max. difference between log2-ratios excluding lowest and highest 5%: |
0.0 |
|
|
|
|
|
|
|
|
|
|
|
|
| Pathway |
Source |
Scores of Genes |
p[Score] |
No. of Genes |
p[genes] |
Link to organ heatmap |
|
|
|
|
|
|
|
| mono-/sesqui-/di-terpene biosynthesis |
LitPath |
16 |
0.000 |
4 |
0.000 |
|
|
|
| terpenoid metabolism |
LitPath |
16 |
0.000 |
4 |
0.000 |
|
|
| Biosynthesis of steroids |
KEGG |
15 |
0.000 |
3 |
0.000 |
|
|
| secondary metabolism |
FunCat |
9 |
0.000 |
2 |
0.000 |
|
|
| triterpene, sterol, and brassinosteroid metabolism |
LitPath |
9 |
0.025 |
2 |
0.152 |
|
|
| Biosynthesis of prenyl diphosphates |
BioPath |
8 |
0.000 |
2 |
0.001 |
|
|
| Plastidial Isoprenoids (Chlorophylls, Carotenoids, Tocopherols, Plastoquinone, Phylloquinone) |
BioPath |
8 |
0.000 |
2 |
0.005 |
|
|
|
|
|
|
|
|
|
|
|
| Terpenoid biosynthesis |
KEGG |
8 |
0.000 |
2 |
0.000 |
|
|
|
|
|
|
|
|
|
|
|
| prenyl diphosphate (GPP,FPP, GGPP) biosynthesis |
LitPath |
8 |
0.000 |
2 |
0.003 |
|
|
|
|
|
|
|
|
|
|
|
| pentacyclic triterpenoid biosynthesis |
TAIR-GO |
7 |
0.000 |
1 |
0.000 |
|
|
|
|
|
|
|
|
|
|
|
| triterpene biosynthesis |
LitPath |
7 |
0.000 |
1 |
0.016 |
|
|
|
|
|
|
|
|
|
|
|
| Cell Wall Carbohydrate Metabolism |
BioPath |
6.5 |
0.034 |
3 |
0.054 |
|
|
|
|
|
|
|
|
|
|
|
| pectin metabolism |
BioPath |
6.5 |
0.000 |
3 |
0.003 |
|
|
|
|
|
|
|
|
|
|
|
|
|
|
|
|
|
|
|
|
|
|
|
|
|
|
|
|
|
|
|
|
|
|
|
|
|
|
|
|
|
|
|
|
|
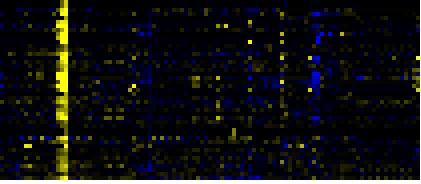
| Pathways co-expressed in the Hormone etc. data set (with more than 10 annotation points) |
|
CYP710A3 / CYP710A4 (At2g28850 / At2g28860) |
|
|
|
|
|
|
|
|
| max. difference between log2-ratios: |
3.0 |
|
|
|
|
|
|
|
|
|
|
|
|
| max. difference between log2-ratios excluding lowest and highest 5%: |
0.0 |
|
|
|
|
|
|
|
|
|
|
|
|
| Pathway |
Source |
Scores of Genes |
p[Score] |
No. of Genes |
p[genes] |
Link to hormones etc. heatmap |
|
|
|
|
|
|
|
| Biosynthesis of Amino Acids and Derivatives |
BioPath |
26 |
0.000 |
5 |
0.013 |
|
|
|
|
|
|
| Isoprenoid Biosynthesis in the Cytosol and in Mitochondria |
BioPath |
24 |
0.000 |
3 |
0.006 |
|
|
|
|
|
| Phenylpropanoid Metabolism |
BioPath |
20 |
0.003 |
4 |
0.052 |
|
|
|
|
|
| amino acid metabolism |
FunCat |
18 |
0.000 |
3 |
0.003 |
|
|
|
|
|
| secondary metabolism |
FunCat |
18 |
0.000 |
6 |
0.000 |
|
|
|
|
|
| Aromatic amino acid (Phe, Tyr, Trp) metabolism |
BioPath |
16 |
0.000 |
2 |
0.027 |
|
|
|
|
|
| Glutathione metabolism |
BioPath |
16 |
0.000 |
2 |
0.049 |
|
|
|
|
|
| cysteine biosynthesis I |
AraCyc |
16 |
0.000 |
2 |
0.014 |
|
|
|
|
|
| sulfate assimilation III |
AraCyc |
16 |
0.000 |
2 |
0.009 |
|
|
|
|
|
| Cysteine metabolism |
KEGG |
16 |
0.000 |
2 |
0.000 |
|
|
|
|
|
| Sulfur metabolism |
KEGG |
16 |
0.000 |
2 |
0.000 |
|
|
|
|
|
| sterol biosynthesis |
BioPath |
14 |
0.000 |
2 |
0.003 |
|
|
|
|
|
|
|
|
|
|
|
| sterol biosynthesis |
AraCyc |
14 |
0.000 |
2 |
0.002 |
|
|
|
|
|
|
|
|
|
|
|
| brassinosteroid biosynthesis |
LitPath |
14 |
0.000 |
2 |
0.013 |
|
|
|
|
|
|
|
|
|
|
|
| sterol and brassinosteroid biosynthesis |
LitPath |
14 |
0.000 |
2 |
0.005 |
|
|
|
|
|
|
|
|
|
|
|
| cellulose biosynthesis |
AraCyc |
12 |
0.000 |
3 |
0.002 |
|
|
|
|
|
|
|
|
|
|
|
| lipid, fatty acid and isoprenoid metabolism |
FunCat |
12 |
0.000 |
2 |
0.002 |
|
|
|
|
|
|
|
|
|
|
|
|
|
|
|
|
|
|
|
|
|
|
|
|
|
|
|
|
|
|
|
|
|
|
|
|
|
|
|
|
|
|
|
|
|
|
|
|
|
|
|
|
|
|
|
|
|
|
|
|
|
|
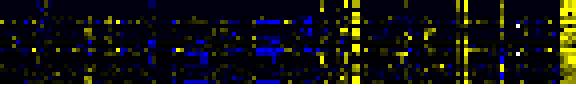
| Pathways co-expressed in the Mutant data set (with more than 6 annotation points) |
|
CYP710A3 / CYP710A4 (At2g28850 / At2g28860) |
|
|
|
|
|
|
|
|
| max. difference between log2-ratios: |
4.9 |
|
|
|
|
|
|
|
|
|
|
|
|
| max. difference between log2-ratios excluding lowest and highest 5%: |
2.0 |
|
|
|
|
|
|
|
|
|
|
|
|
| Pathway |
Source |
Scores of Genes |
p[Score] |
No. of Genes |
p[genes] |
Link to mutants heatmap |
|
|
|
|
|
|
|
| Aromatic amino acid (Phe, Tyr, Trp) metabolism |
BioPath |
10 |
0.000 |
1 |
0.008 |
|
|
|
|
| Phenylpropanoid Metabolism |
BioPath |
10 |
0.000 |
1 |
0.071 |
|
|
|
| tryptophan biosynthesis |
TAIR-GO |
10 |
0.000 |
1 |
0.002 |
|
|
|
| amino acid metabolism |
FunCat |
10 |
0.000 |
1 |
0.015 |
|
|
|
| metabolism of the cysteine - aromatic group |
FunCat |
10 |
0.000 |
1 |
0.000 |
|
|
|
| Phenylalanine metabolism |
KEGG |
10 |
0.000 |
3 |
0.000 |
|
|
|
| Shikimate pathway |
LitPath |
10 |
0.000 |
1 |
0.003 |
|
|
|
|
|
|
|
|
|
|
|
| Trp biosyntesis |
LitPath |
10 |
0.000 |
1 |
0.001 |
|
|
|
|
|
|
|
|
|
|
|
| Leaf Glycerolipid Biosynthesis |
BioPath |
8 |
0.002 |
2 |
0.008 |
|
|
|
|
|
|
|
|
|
|
|
| Leaf Glycerolipid Biosynthesis in Plastid |
BioPath |
8 |
0.000 |
2 |
0.000 |
|
|
|
|
|
|
|
|
|
|
|
| Synthesis of fatty acids in plastids |
AcylLipid |
8 |
0.000 |
2 |
0.000 |
|
|
|
|
|
|
|
|
|
|
|
|
|
|
|
|
|
|
|
|
|
|
|
|
|
|
|
|