|
|
|
|
|
|
|
|
|
|
|
|
|
|
|
|
|
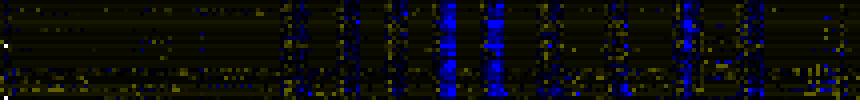
| Pathways co-expressed in the Organ and Tissue data set (with more than 9 annotation points) |
|
CYP714A2 (At5g24900) |
|
|
|
|
|
|
|
|
| max. difference between log2-ratios: |
1.8 |
|
|
|
|
|
|
|
|
|
|
|
|
| max. difference between log2-ratios excluding lowest and highest 5%: |
0.0 |
|
|
|
|
|
|
|
|
|
|
|
|
| Pathway |
Source |
Scores of Genes |
p[Score] |
No. of Genes |
p[genes] |
Link to organ heatmap |
|
|
|
|
|
|
|
| Cell Wall Carbohydrate Metabolism |
BioPath |
34 |
0.000 |
10 |
0.003 |
|
|
|
| Phenylpropanoid Metabolism |
BioPath |
24 |
0.000 |
5 |
0.026 |
|
|
| Flavonoid and anthocyanin metabolism |
BioPath |
20 |
0.000 |
3 |
0.006 |
|
|
| pectin metabolism |
BioPath |
18 |
0.000 |
7 |
0.001 |
|
|
| Gibberellin metabolism |
LitPath |
14 |
0.000 |
3 |
0.000 |
|
|
| giberelin biosynthesis |
LitPath |
14 |
0.000 |
3 |
0.000 |
|
|
| Stilbene, coumarine and lignin biosynthesis |
KEGG |
12 |
0.000 |
2 |
0.017 |
|
|
| Biosynthesis of prenyl diphosphates |
BioPath |
10 |
0.000 |
1 |
0.119 |
|
|
| Isoprenoid Biosynthesis in the Cytosol and in Mitochondria |
BioPath |
10 |
0.006 |
1 |
0.210 |
|
|
| trehalose metabolism |
BioPath |
10 |
0.000 |
2 |
0.001 |
|
|
| dolichol biosynthesis |
TAIR-GO |
10 |
0.000 |
1 |
0.000 |
|
|
| proanthocyanidin biosynthesis |
TAIR-GO |
10 |
0.000 |
1 |
0.000 |
|
|
| (deoxy)ribose phosphate degradation |
AraCyc |
10 |
0.000 |
2 |
0.000 |
|
|
|
|
|
|
|
|
|
|
|
| anthocyanin biosynthesis |
AraCyc |
10 |
0.000 |
1 |
0.002 |
|
|
|
|
|
|
|
|
|
|
|
| trehalose biosynthesis I |
AraCyc |
10 |
0.000 |
2 |
0.010 |
|
|
|
|
|
|
|
|
|
|
|
| trehalose biosynthesis II |
AraCyc |
10 |
0.000 |
2 |
0.004 |
|
|
|
|
|
|
|
|
|
|
|
| trehalose biosynthesis III |
AraCyc |
10 |
0.000 |
2 |
0.001 |
|
|
|
|
|
|
|
|
|
|
|
| energy |
FunCat |
10 |
0.000 |
2 |
0.000 |
|
|
|
|
|
|
|
|
|
|
|
| metabolism of energy reserves (e.g. glycogen, trehalose) |
FunCat |
10 |
0.000 |
2 |
0.000 |
|
|
|
|
|
|
|
|
|
|
|
| nucleotide metabolism |
FunCat |
10 |
0.000 |
2 |
0.000 |
|
|
|
|
|
|
|
|
|
|
|
| pyrimidine nucleotide metabolism |
FunCat |
10 |
0.000 |
2 |
0.001 |
|
|
|
|
|
|
|
|
|
|
|
| Ascorbate and aldarate metabolism |
KEGG |
10 |
0.000 |
1 |
0.008 |
|
|
|
|
|
|
|
|
|
|
|
| Fluorene degradation |
KEGG |
10 |
0.000 |
1 |
0.003 |
|
|
|
|
|
|
|
|
|
|
|
| gamma-Hexachlorocyclohexane degradation |
KEGG |
10 |
0.000 |
1 |
0.004 |
|
|
|
|
|
|
|
|
|
|
|
| Nucleotide Metabolism |
KEGG |
10 |
0.000 |
2 |
0.008 |
|
|
|
|
|
|
|
|
|
|
|
| Pyrimidine metabolism |
KEGG |
10 |
0.000 |
2 |
0.001 |
|
|
|
|
|
|
|
|
|
|
|
| flavonoid, anthocyanin, and proanthocyanidin biosynthesis |
LitPath |
10 |
0.000 |
1 |
0.020 |
|
|
|
|
|
|
|
|
|
|
|
| polyprenyl diphosphate biosynthesis |
LitPath |
10 |
0.000 |
1 |
0.010 |
|
|
|
|
|
|
|
|
|
|
|
| proanthocyanidin biosynthesis |
LitPath |
10 |
0.000 |
1 |
0.020 |
|
|
|
|
|
|
|
|
|
|
|
|
|
|
|
|
|
|
|
|
|
|
|
|
|
|
|
|
|
|
|
|
|
|
|
|
|
|
|
|
|
|
|
|
|
|
|
|
|
|
|
|
|
|
|
|
|
|
|
|
|
|
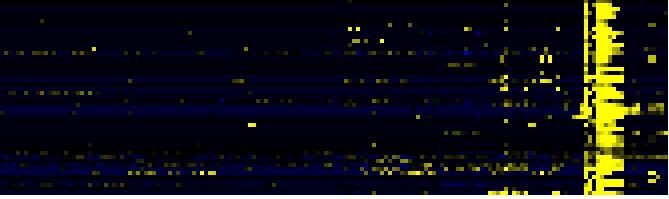
| Pathways co-expressed in the Mutant data set (with more than 10 annotation points) |
|
CYP714A2 (At5g24900) |
|
|
|
|
|
|
|
|
| max. difference between log2-ratios: |
1.4 |
|
|
|
|
|
|
|
|
|
|
|
|
| max. difference between log2-ratios excluding lowest and highest 5%: |
0.0 |
|
|
|
|
|
|
|
|
|
|
|
|
| Pathway |
Source |
Scores of Genes |
p[Score] |
No. of Genes |
p[genes] |
Link to mutants heatmap |
|
|
|
|
|
|
|
| Biosynthesis of prenyl diphosphates |
BioPath |
12 |
0.000 |
3 |
0.000 |

|
|
|
|
| core phenylpropanoid metabolism |
BioPath |
10 |
0.000 |
1 |
0.020 |
|
|
|
| Phenylpropanoid Metabolism |
BioPath |
10 |
0.000 |
1 |
0.204 |
|
|
|
| Plastidial Isoprenoids (Chlorophylls, Carotenoids, Tocopherols, Plastoquinone, Phylloquinone) |
BioPath |
8 |
0.000 |
2 |
0.007 |
|
|
|
| Biosynthesis of steroids |
KEGG |
8 |
0.000 |
2 |
0.000 |
|
|
|
|
|
|
|
|
|
|
|
| Terpenoid biosynthesis |
KEGG |
8 |
0.000 |
2 |
0.000 |
|
|
|
|
|
|
|
|
|
|
|
| prenyl diphosphate (GPP,FPP, GGPP) biosynthesis |
LitPath |
8 |
0.000 |
2 |
0.000 |
|
|
|
|
|
|
|
|
|
|
|
|
|
|
|
|
|
|
|
|
|
|
|
|
|
|
|
|