| _________________________________________ |
|
|
|
|
|
|
|
|
|
|
|
|
|
|
|
| Pathways co-expressed in the 3 data sets with co-expressed pathways (with more than 6 annotation points each) |
|
Find below a list of pathways that are co-expressed with the bait. First a list of pathways is given that are co-expressed in all data sets. Lists for each individual dataset are shown underneath. Depending on the number of co-expressed pathways only the top scoring pathways are given; all data can be saved as text using the link above. |
|
|
|
|
|
|
| Pathway |
Source |
Sum of scores |
Sum of genes |
|
|
|
|
|
|
|
| Biosynthesis of Amino Acids and Derivatives |
BioPath |
132 |
21 |
|
|
|
|
|
|
|
| Methionin/SAM/ethylene metabolism from cysteine and aspartate |
BioPath |
100 |
15 |
|
|
|
|
|
|
|
|
|
| Lipid signaling |
AcylLipid |
92 |
25 |
|
|
|
|
|
|
|
|
|
| Propanoate metabolism |
KEGG |
80 |
13 |
|
To the right of each table a thumbnail of the actual co-expression heatmap is given. Klick on the link to see the heatmap containing all co-expressed genes. |
|
|
|
|
|
|
|
|
| ethylene biosynthesis |
TAIR-GO |
64 |
10 |
|
|
|
|
|
|
|
|
|
| biosynthesis of proto- and siroheme |
AraCyc |
58 |
7 |
|
|
|
|
|
|
|
|
|
| jasmonic acid biosynthesis |
TAIR-GO |
52 |
10 |
|
For more information on how these pathway maps were generated please read the methods page |
|
|
|
|
|
|
|
|
| jasmonic acid biosynthesis |
TAIR-GO |
52 |
10 |
|
|
|
|
|
|
|
|
|
| Chlorophyll biosynthesis and breakdown |
BioPath |
50 |
5 |
|
|
|
|
|
|
|
|
|
|
|
|
|
| Porphyrin and chlorophyll metabolism |
KEGG |
50 |
5 |
|
|
|
|
|
|
|
|
|
|
|
|
|
| chlorophyll and phytochromobilin metabolism |
LitPath |
50 |
5 |
|
|
|
|
|
|
|
|
|
|
|
|
|
| chlorophyll biosynthesis |
AraCyc |
38 |
5 |
|
|
|
|
|
|
|
|
|
|
|
|
|
| nucleotide metabolism |
TAIR-GO |
37 |
5 |
|
|
|
|
|
|
|
|
|
|
|
|
|
| porphyrin biosynthesis |
TAIR-GO |
30 |
3 |
|
|
|
|
|
|
|
|
|
|
|
|
|
| chlorophyll and phyochromobilin biosynthesis |
LitPath |
30 |
3 |
|
|
|
|
|
|
|
|
|
|
|
|
|
| gibberellic acid catabolism |
TAIR-GO |
29 |
3 |
|
|
|
|
|
|
|
|
|
|
|
|
|
|
|
|
|
|
|
|
|
|
|
|
|
|
|
|
|
|
|
|
|
|
|
|
|
|
|
|
|
|
|
|
|
|
|
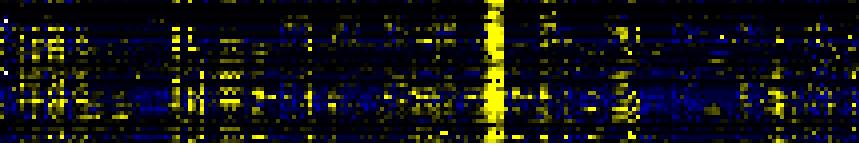
| Pathways co-expressed in the Stress data set ( with more than 9 annotation points) |
|
CYP715A1 (At5g52400) |
|
|
|
|
|
|
|
|
| max. difference between log2-ratios: |
8.7 |
|
|
|
|
|
|
|
|
|
|
|
|
| max. difference between log2-ratios excluding lowest and highest 5%: |
2.0 |
|
|
|
|
|
|
|
|
|
|
|
|
| Pathway |
Source |
Scores of Genes |
p[Score] |
No. of Genes |
p[genes] |
Link to stress heatmap |
|
|
|
|
|
|
|
| Biosynthesis of Amino Acids and Derivatives |
BioPath |
22 |
0.000 |
4 |
0.004 |
|
| Methionin/SAM/ethylene metabolism from cysteine and aspartate |
BioPath |
20 |
0.000 |
3 |
0.000 |
| ethylene biosynthesis |
TAIR-GO |
20 |
0.000 |
3 |
0.000 |
| Propanoate metabolism |
KEGG |
20 |
0.000 |
3 |
0.000 |
| Lipid signaling |
AcylLipid |
14 |
0.000 |
4 |
0.004 |
| lipid, fatty acid and isoprenoid metabolism |
FunCat |
12 |
0.000 |
2 |
0.000 |
| response to auxin stimulus |
TAIR-GO |
11 |
0.000 |
2 |
0.000 |
| de novo biosynthesis of purine nucleotides I |
AraCyc |
11 |
0.000 |
2 |
0.009 |
| Biosynthesis of prenyl diphosphates |
BioPath |
10 |
0.000 |
1 |
0.035 |
| Chlorophyll biosynthesis and breakdown |
BioPath |
10 |
0.000 |
1 |
0.020 |
|
|
|
|
|
|
|
|
|
|
|
| Isoprenoid Biosynthesis in the Cytosol and in Mitochondria |
BioPath |
10 |
0.001 |
1 |
0.067 |
|
|
|
|
|
|
|
|
|
|
|
| Leaf Glycerolipid Biosynthesis in Plastid |
BioPath |
10 |
0.000 |
1 |
0.056 |
|
|
|
|
|
|
|
|
|
|
|
| Plastidial Isoprenoids (Chlorophylls, Carotenoids, Tocopherols, Plastoquinone, Phylloquinone) |
BioPath |
10 |
0.009 |
1 |
0.107 |
|
|
|
|
|
|
|
|
|
|
|
| chloroplast envelope |
TAIR-GO |
10 |
0.000 |
1 |
0.000 |
|
|
|
|
|
|
|
|
|
|
|
| defense response |
TAIR-GO |
10 |
0.000 |
2 |
0.002 |
|
|
|
|
|
|
|
|
|
|
|
| galactolipid biosynthesis |
TAIR-GO |
10 |
0.000 |
1 |
0.002 |
|
|
|
|
|
|
|
|
|
|
|
| glycolipid biosynthesis |
TAIR-GO |
10 |
0.000 |
1 |
0.001 |
|
|
|
|
|
|
|
|
|
|
|
| growth |
TAIR-GO |
10 |
0.000 |
2 |
0.004 |
|
|
|
|
|
|
|
|
|
|
|
| jasmonic acid biosynthesis |
TAIR-GO |
10 |
0.000 |
2 |
0.002 |
|
|
|
|
|
|
|
|
|
|
|
| lipid biosynthesis |
TAIR-GO |
10 |
0.000 |
1 |
0.002 |
|
|
|
|
|
|
|
|
|
|
|
| porphyrin biosynthesis |
TAIR-GO |
10 |
0.000 |
1 |
0.013 |
|
|
|
|
|
|
|
|
|
|
|
| response to wounding |
TAIR-GO |
10 |
0.000 |
2 |
0.003 |
|
|
|
|
|
|
|
|
|
|
|
| biosynthesis of proto- and siroheme |
AraCyc |
10 |
0.000 |
1 |
0.017 |
|
|
|
|
|
|
|
|
|
|
|
| chlorophyll biosynthesis |
AraCyc |
10 |
0.000 |
1 |
0.027 |
|
|
|
|
|
|
|
|
|
|
|
| glycosylglyceride biosynthesis |
AraCyc |
10 |
0.000 |
1 |
0.000 |
|
|
|
|
|
|
|
|
|
|
|
| jasmonic acid biosynthesis |
AraCyc |
10 |
0.000 |
2 |
0.000 |
|
|
|
|
|
|
|
|
|
|
|
| lipoxygenase pathway |
AraCyc |
10 |
0.000 |
2 |
0.000 |
|
|
|
|
|
|
|
|
|
|
|
| Porphyrin and chlorophyll metabolism |
KEGG |
10 |
0.000 |
1 |
0.014 |
|
|
|
|
|
|
|
|
|
|
|
| Synthesis of membrane lipids in plastids |
AcylLipid |
10 |
0.000 |
1 |
0.018 |
|
|
|
|
|
|
|
|
|
|
|
| chlorophyll and phyochromobilin biosynthesis |
LitPath |
10 |
0.000 |
1 |
0.006 |
|
|
|
|
|
|
|
|
|
|
|
| chlorophyll and phytochromobilin metabolism |
LitPath |
10 |
0.000 |
1 |
0.030 |
|
|
|
|
|
|
|
|
|
|
|
| prenyl diphosphate (GPP,FPP, GGPP) biosynthesis |
LitPath |
10 |
0.000 |
1 |
0.006 |
|
|
|
|
|
|
|
|
|
|
|
|
|
|
|
|
|
|
|
|
|
|
|
|
|
|
|
|
|
|
|
|
|
|
|
|
|
|
|
|
|
|
|
|
|
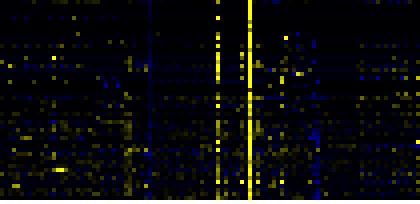
| Pathways co-expressed in the Hormone etc. data set (with more than 20 annotation points) |
|
CYP715A1 (At5g52400) |
|
|
|
|
|
|
|
|
| max. difference between log2-ratios: |
6.0 |
|
|
|
|
|
|
|
|
|
|
|
|
| max. difference between log2-ratios excluding lowest and highest 5%: |
1.0 |
|
|
|
|
|
|
|
|
|
|
|
|
| Pathway |
Source |
Scores of Genes |
p[Score] |
No. of Genes |
p[genes] |
Link to hormones etc. heatmap |
|
|
|
|
|
|
|
| Biosynthesis of Amino Acids and Derivatives |
BioPath |
62 |
0.000 |
10 |
0.011 |
|
|
|
|
|
|
| Phenylpropanoid Metabolism |
BioPath |
62 |
0.000 |
10 |
0.014 |
|
|
|
|
|
| Lipid signaling |
AcylLipid |
58 |
0.000 |
13 |
0.004 |
|
|
|
|
|
| response to pathogenic bacteria |
TAIR-GO |
50.5 |
0.000 |
8 |
0.000 |
|
|
|
|
|
| Aromatic amino acid (Phe, Tyr, Trp) metabolism |
BioPath |
46 |
0.000 |
7 |
0.000 |
|
|
|
|
|
| Methionin/SAM/ethylene metabolism from cysteine and aspartate |
BioPath |
44 |
0.000 |
7 |
0.000 |
|
|
|
|
|
| Miscellaneous acyl lipid metabolism |
AcylLipid |
42 |
0.000 |
10 |
0.124 |
|
|
|
|
|
| Shikimate pathway |
LitPath |
42 |
0.000 |
7 |
0.001 |
|
|
|
|
|
| tryptophan biosynthesis |
TAIR-GO |
38 |
0.000 |
6 |
0.000 |
|
|
|
|
|
| tryptophan biosynthesis |
AraCyc |
38 |
0.000 |
6 |
0.000 |
|
|
|
|
|
| Trp biosyntesis |
LitPath |
38 |
0.000 |
6 |
0.000 |
|
|
|
|
|
| Inositol phosphate metabolism |
KEGG |
37 |
0.000 |
13 |
0.000 |
|
|
|
|
|
| Phenylpropanoid pathway |
LitPath |
36 |
0.000 |
7 |
0.047 |
|
|
|
|
|
|
|
|
|
|
|
| Propanoate metabolism |
KEGG |
34 |
0.000 |
6 |
0.000 |
|
|
|
|
|
|
|
|
|
|
|
| Benzoate degradation via CoA ligation |
KEGG |
33 |
0.000 |
12 |
0.000 |
|
|
|
|
|
|
|
|
|
|
|
| Nicotinate and nicotinamide metabolism |
KEGG |
33 |
0.000 |
12 |
0.000 |
|
|
|
|
|
|
|
|
|
|
|
| secondary metabolism |
FunCat |
32 |
0.000 |
6 |
0.001 |
|
|
|
|
|
|
|
|
|
|
|
| Plastidial Isoprenoids (Chlorophylls, Carotenoids, Tocopherols, Plastoquinone, Phylloquinone) |
BioPath |
30 |
0.010 |
3 |
0.247 |
|
|
|
|
|
|
|
|
|
|
|
| Glycan Biosynthesis and Metabolism |
KEGG |
25 |
0.000 |
7 |
0.003 |
|
|
|
|
|
|
|
|
|
|
|
| ethylene biosynthesis |
TAIR-GO |
24 |
0.000 |
4 |
0.000 |
|
|
|
|
|
|
|
|
|
|
|
| biosynthesis of proto- and siroheme |
AraCyc |
24 |
0.000 |
3 |
0.029 |
|
|
|
|
|
|
|
|
|
|
|
| biogenesis of chloroplast |
FunCat |
24 |
0.000 |
3 |
0.092 |
|
|
|
|
|
|
|
|
|
|
|
| lipases pathway |
AraCyc |
23 |
0.000 |
4 |
0.001 |
|
|
|
|
|
|
|
|
|
|
|
| defense response |
TAIR-GO |
22.5 |
0.000 |
4 |
0.001 |
|
|
|
|
|
|
|
|
|
|
|
| triacylglycerol degradation |
AraCyc |
22.5 |
0.000 |
7 |
0.000 |
|
|
|
|
|
|
|
|
|
|
|
| response to wounding |
TAIR-GO |
22 |
0.000 |
5 |
0.000 |
|
|
|
|
|
|
|
|
|
|
|
| lignin biosynthesis |
AraCyc |
22 |
0.000 |
5 |
0.001 |
|
|
|
|
|
|
|
|
|
|
|
| lipid, fatty acid and isoprenoid degradation |
FunCat |
22 |
0.000 |
3 |
0.006 |
|
|
|
|
|
|
|
|
|
|
|
|
|
|
|
|
|
|
|
|
|
|
|
|
|
|
|
|
|
|
|
|
|
|
|
|
|
|
|
|
|
|
|
|
|
|
|
|
|
|
|
|
|
|
|
|
|
|
|
|
|
|
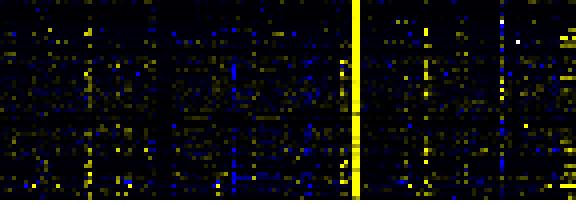
| Pathways co-expressed in the Mutant data set (with more than 18 annotation points) |
|
CYP715A1 (At5g52400) |
|
|
|
|
|
|
|
|
| max. difference between log2-ratios: |
5.6 |
|
|
|
|
|
|
|
|
|
|
|
|
| max. difference between log2-ratios excluding lowest and highest 5%: |
1.3 |
|
|
|
|
|
|
|
|
|
|
|
|
| Pathway |
Source |
Scores of Genes |
p[Score] |
No. of Genes |
p[genes] |
Link to mutants heatmap |
|
|
|
|
|
|
|
| Phenylpropanoid Metabolism |
BioPath |
78 |
0.000 |
12 |
0.000 |
|
|
|
|
| Aromatic amino acid (Phe, Tyr, Trp) metabolism |
BioPath |
52 |
0.000 |
8 |
0.000 |
|
|
|
| Shikimate pathway |
LitPath |
52 |
0.000 |
8 |
0.000 |
|
|
|
| Biosynthesis of Amino Acids and Derivatives |
BioPath |
48 |
0.000 |
7 |
0.044 |
|
|
|
| tryptophan biosynthesis |
TAIR-GO |
48 |
0.000 |
7 |
0.000 |
|
|
|
| tryptophan biosynthesis |
AraCyc |
48 |
0.000 |
7 |
0.000 |
|
|
|
| Trp biosyntesis |
LitPath |
48 |
0.000 |
7 |
0.000 |
|
|
|
| Phenylpropanoid pathway |
LitPath |
46 |
0.000 |
8 |
0.009 |
|
|
|
| response to pathogenic bacteria |
TAIR-GO |
38 |
0.000 |
6 |
0.000 |
|
|
|
| Methionin/SAM/ethylene metabolism from cysteine and aspartate |
BioPath |
36 |
0.000 |
5 |
0.000 |
|
|
|
| lignin biosynthesis |
AraCyc |
30 |
0.000 |
5 |
0.000 |
|
|
|
| core phenylpropanoid metabolism |
BioPath |
26 |
0.000 |
4 |
0.004 |
|
|
|
| Propanoate metabolism |
KEGG |
26 |
0.000 |
4 |
0.001 |
|
|
|
|
|
|
|
|
|
|
|
| biosynthesis of proto- and siroheme |
AraCyc |
24 |
0.000 |
3 |
0.014 |
|
|
|
|
|
|
|
|
|
|
|
| biogenesis of chloroplast |
FunCat |
24 |
0.000 |
3 |
0.049 |
|
|
|
|
|
|
|
|
|
|
|
| secondary metabolism |
FunCat |
22 |
0.000 |
4 |
0.011 |
|
|
|
|
|
|
|
|
|
|
|
| Phenylalanine, tyrosine and tryptophan biosynthesis |
KEGG |
22 |
0.000 |
3 |
0.030 |
|
|
|
|
|
|
|
|
|
|
|
| Benzoate degradation via CoA ligation |
KEGG |
21 |
0.000 |
7 |
0.003 |
|
|
|
|
|
|
|
|
|
|
|
| Inositol phosphate metabolism |
KEGG |
21 |
0.000 |
7 |
0.005 |
|
|
|
|
|
|
|
|
|
|
|
| Nicotinate and nicotinamide metabolism |
KEGG |
21 |
0.000 |
7 |
0.002 |
|
|
|
|
|
|
|
|
|
|
|
| Chlorophyll biosynthesis and breakdown |
BioPath |
20 |
0.000 |
2 |
0.044 |
|
|
|
|
|
|
|
|
|
|
|
| ethylene biosynthesis |
TAIR-GO |
20 |
0.000 |
3 |
0.000 |
|
|
|
|
|
|
|
|
|
|
|
| Porphyrin and chlorophyll metabolism |
KEGG |
20 |
0.000 |
2 |
0.037 |
|
|
|
|
|
|
|
|
|
|
|
| Lipid signaling |
AcylLipid |
20 |
0.004 |
8 |
0.038 |
|
|
|
|
|
|
|
|
|
|
|
| chlorophyll and phytochromobilin metabolism |
LitPath |
20 |
0.029 |
2 |
0.212 |
|
|
|
|
|
|
|
|
|
|
|
|
|
|
|
|
|
|
|
|
|
|
|
|
|
|
|
|