|
|
|
|
|
|
|
|
|
|
|
|
|
|
|
|
|
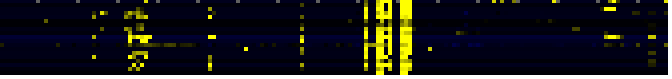
| Pathways co-expressed in the Hormone etc. data set (with more than 6 annotation points) |
|
CYPX716A1(At5g36110) |
|
|
|
|
|
|
|
|
| max. difference between log2-ratios: |
4.2 |
|
|
|
|
|
|
|
|
|
|
|
|
| max. difference between log2-ratios excluding lowest and highest 5%: |
3.1 |
|
|
|
|
|
|
|
|
|
|
|
|
| Pathway |
Source |
Scores of Genes |
p[Score] |
No. of Genes |
p[genes] |
Link to hormones etc. heatmap |
|
|
|
|
|
|
|
| Cell Wall Carbohydrate Metabolism |
BioPath |
10 |
0.000 |
1 |
0.043 |

|
|
|
|
|
|
| GDP-carbohydrate biosynthesis |
BioPath |
10 |
0.000 |
1 |
0.000 |
|
|
|
|
|
| lipoic acid metabolism |
TAIR-GO |
10 |
0.000 |
1 |
0.000 |
|
|
|
|
|
|
|
|
|
|
|
| colanic acid building blocks biosynthesis |
AraCyc |
10 |
0.000 |
1 |
0.005 |
|
|
|
|
|
|
|
|
|
|
|
| dTDP-rhamnose biosynthesis |
AraCyc |
10 |
0.000 |
1 |
0.003 |
|
|
|
|
|
|
|
|
|
|
|
| galactose degradation I |
AraCyc |
10 |
0.000 |
1 |
0.000 |
|
|
|
|
|
|
|
|
|
|
|
| glucose conversion |
AraCyc |
10 |
0.000 |
1 |
0.003 |
|
|
|
|
|
|
|
|
|
|
|
| lactose degradation IV |
AraCyc |
10 |
0.000 |
1 |
0.000 |
|
|
|
|
|
|
|
|
|
|
|
| UDP-glucose conversion |
AraCyc |
10 |
0.000 |
1 |
0.003 |
|
|
|
|
|
|
|
|
|
|
|
| Fructose and mannose metabolism |
KEGG |
10 |
0.000 |
1 |
0.000 |
|
|
|
|
|
|
|
|
|
|
|
| metabolism of acyl-lipids in mitochondria |
AcylLipid |
10 |
0.000 |
1 |
0.000 |
|
|
|
|
|
|
|
|
|
|
|
|
|
|
|
|
|
|
|
|
|
|
|
|
|
|
|
|
|
|
|
|
|
|
|
|
|
|
|
|
|
|
|
|
|
|
|
|
|
|
|
|
|
|
|
|
|
|
|
|
|
|
| Pathways co-expressed in the Mutant data set (with more than 6 annotation points) |
|
CYPX716A1(At5g36110) |
|
|
|
|
|
|
|
|
| max. difference between log2-ratios: |
5.3 |
|
|
|
|
|
|
|
|
|
|
|
|
| max. difference between log2-ratios excluding lowest and highest 5%: |
2.2 |
|
|
|
|
|
|
|
|
|
|
|
|
| Pathway |
Source |
Scores of Genes |
p[Score] |
No. of Genes |
p[genes] |
Link to mutants heatmap |
|
|
|
|
|
|
|
| Photosystems |
BioPath |
22 |
0.000 |
3 |
0.003 |

|
|
|
|
| additional photosystem II components |
BioPath |
16 |
0.000 |
2 |
0.001 |
|
|
|
| ATP synthase components |
BioPath |
16 |
0.000 |
2 |
0.000 |
|
|
|
| ATP synthesis coupled proton transport |
TAIR-GO |
16 |
0.000 |
2 |
0.000 |
|
|
|
| proton transport |
TAIR-GO |
16 |
0.000 |
2 |
0.000 |
|
|
|
| Ribosome |
KEGG |
12 |
0.042 |
2 |
0.137 |
|
|
|
| Miscellaneous acyl lipid metabolism |
AcylLipid |
12 |
0.000 |
2 |
0.000 |
|
|
|
| Intermediary Carbon Metabolism |
BioPath |
10 |
0.030 |
1 |
0.244 |
|
|
|
|
|
|
|
|
|
|
|
| starch metabolism |
BioPath |
10 |
0.000 |
1 |
0.013 |
|
|
|
|
|
|
|
|
|
|
|
| fatty acid biosynthesis |
TAIR-GO |
10 |
0.000 |
1 |
0.013 |
|
|
|
|
|
|
|
|
|
|
|
| proton-transporting ATP synthase, catalytic core (sensu Eukaryota) |
TAIR-GO |
10 |
0.000 |
1 |
0.000 |
|
|
|
|
|
|
|
|
|
|
|
| starch catabolism |
TAIR-GO |
10 |
0.000 |
1 |
0.000 |
|
|
|
|
|
|
|
|
|
|
|
| Calvin cycle |
AraCyc |
10 |
0.000 |
1 |
0.012 |
|
|
|
|
|
|
|
|
|
|
|
| fatty acid oxidation pathway |
AraCyc |
10 |
0.000 |
1 |
0.003 |
|
|
|
|
|
|
|
|
|
|
|
| octane oxidation |
AraCyc |
10 |
0.000 |
1 |
0.001 |
|
|
|
|
|
|
|
|
|
|
|
| starch degradation |
AraCyc |
10 |
0.000 |
1 |
0.002 |
|
|
|
|
|
|
|
|
|
|
|
| C-compound and carbohydrate utilization |
FunCat |
10 |
0.000 |
1 |
0.000 |
|
|
|
|
|
|
|
|
|
|
|
| energy |
FunCat |
10 |
0.000 |
1 |
0.000 |
|
|
|
|
|
|
|
|
|
|
|
| glycolysis and gluconeogenesis |
FunCat |
10 |
0.005 |
1 |
0.145 |
|
|
|
|
|
|
|
|
|
|
|
| metabolism of energy reserves (e.g. glycogen, trehalose) |
FunCat |
10 |
0.000 |
1 |
0.000 |
|
|
|
|
|
|
|
|
|
|
|
| photosynthesis |
FunCat |
10 |
0.000 |
1 |
0.026 |
|
|
|
|
|
|
|
|
|
|
|
| protein synthesis |
FunCat |
10 |
0.006 |
2 |
0.033 |
|
|
|
|
|
|
|
|
|
|
|
| Carbon fixation |
KEGG |
10 |
0.000 |
1 |
0.043 |
|
|
|
|
|
|
|
|
|
|
|
| Fatty acid metabolism |
KEGG |
10 |
0.000 |
1 |
0.013 |
|
|
|
|
|
|
|
|
|
|
|
| Glyoxylate and dicarboxylate metabolism |
KEGG |
10 |
0.000 |
1 |
0.009 |
|
|
|
|
|
|
|
|
|
|
|
| Starch and sucrose metabolism |
KEGG |
10 |
0.000 |
1 |
0.056 |
|
|
|
|
|
|
|
|
|
|
|
| pentacyclic triterpenoid biosynthesis |
TAIR-GO |
7 |
0.000 |
1 |
0.004 |
|
|
|
|
|
|
|
|
|
|
|
| isoprenoid biosynthesis |
FunCat |
7 |
0.004 |
1 |
0.047 |
|
|
|
|
|
|
|
|
|
|
|
| lipid, fatty acid and isoprenoid biosynthesis |
FunCat |
7 |
0.002 |
1 |
0.037 |
|
|
|
|
|
|
|
|
|
|
|
| Biosynthesis of steroids |
KEGG |
7 |
0.001 |
1 |
0.023 |
|
|
|
|
|
|
|
|
|
|
|
| triterpene biosynthesis |
LitPath |
7 |
0.000 |
1 |
0.002 |
|
|
|
|
|
|
|
|
|
|
|
| triterpene, sterol, and brassinosteroid metabolism |
LitPath |
7 |
0.001 |
1 |
0.079 |
|
|
|
|
|
|
|
|
|
|
|
| Translation factors |
KEGG |
6.5 |
0.002 |
2 |
0.009 |
|
|
|
|
|
|
|
|
|
|
|
|
|
|
|
|
|
|
|
|
|
|
|
|
|
|
|
|