|
|
|
|
|
|
|
|
|
|
|
|
|
|
|
|
|
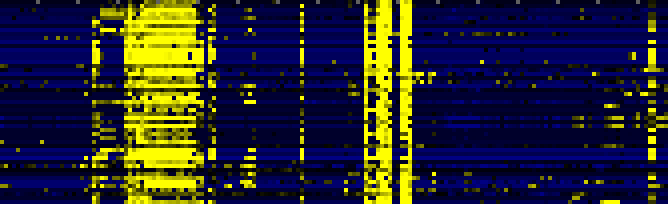
| Pathways co-expressed in the Organ and Tissue data set (with more than10 annotation points) |
|
CYP716A2 (At5g36140) |
|
|
|
|
|
|
|
|
| max. difference between log2-ratios: |
4.3 |
|
|
|
|
|
|
|
|
|
|
|
|
| max. difference between log2-ratios excluding lowest and highest 5%: |
2.2 |
|
|
|
|
|
|
|
|
|
|
|
|
| Pathway |
Source |
Scores of Genes |
p[Score] |
No. of Genes |
p[genes] |
Link to organ heatmap |
|
|
|
|
|
|
|
| Stilbene, coumarine and lignin biosynthesis |
KEGG |
46 |
0.000 |
17 |
0.000 |
|
|
|
|
|
|
|
|
|
|
|
| Phenylalanine metabolism |
KEGG |
45 |
0.000 |
17 |
0.000 |
|
|
|
| Methane metabolism |
KEGG |
36 |
0.000 |
16 |
0.000 |
|
|
| Prostaglandin and leukotriene metabolism |
KEGG |
36 |
0.000 |
16 |
0.000 |
|
|
| mono-/sesqui-/di-terpene biosynthesis |
LitPath |
27 |
0.000 |
4 |
0.007 |
|
|
| terpenoid metabolism |
LitPath |
27 |
0.000 |
4 |
0.008 |
|
|
| Phenylpropanoid Metabolism |
BioPath |
22 |
0.000 |
6 |
0.002 |
|
|
| Miscellaneous acyl lipid metabolism |
AcylLipid |
22 |
0.000 |
11 |
0.000 |
|
|
| triterpene, sterol, and brassinosteroid metabolism |
LitPath |
21 |
0.005 |
6 |
0.015 |
|
|
| monoterpenoid biosynthesis |
TAIR-GO |
19 |
0.000 |
2 |
0.000 |
|
|
| detoxification |
FunCat |
19 |
0.000 |
6 |
0.000 |
|
|
| monoterpene biosynthesis |
LitPath |
19 |
0.000 |
2 |
0.001 |
|
|
| Lipid signaling |
AcylLipid |
18 |
0.019 |
3 |
0.596 |
|
|
| cation transport (Na, K, Ca , NH4, etc.) |
FunCat |
17 |
0.000 |
2 |
0.000 |
|
|
| heavy metal ion transport (Cu, Fe, etc.) |
FunCat |
17 |
0.000 |
2 |
0.000 |
|
|
|
|
|
|
|
|
|
|
|
| ion transport |
FunCat |
17 |
0.000 |
2 |
0.000 |
|
|
|
|
|
|
|
|
|
|
|
| transport |
FunCat |
17 |
0.000 |
2 |
0.000 |
|
|
|
|
|
|
|
|
|
|
|
| transport facilitation |
FunCat |
17 |
0.000 |
2 |
0.000 |
|
|
|
|
|
|
|
|
|
|
|
| transported compounds (substrates) |
FunCat |
17 |
0.000 |
2 |
0.000 |
|
|
|
|
|
|
|
|
|
|
|
| isoprenoid biosynthesis |
FunCat |
14 |
0.000 |
3 |
0.018 |
|
|
|
|
|
|
|
|
|
|
|
| lipid, fatty acid and isoprenoid biosynthesis |
FunCat |
14 |
0.000 |
3 |
0.011 |
|
|
|
|
|
|
|
|
|
|
|
| Biosynthesis of steroids |
KEGG |
13 |
0.002 |
2 |
0.085 |
|
|
|
|
|
|
|
|
|
|
|
| triterpene biosynthesis |
LitPath |
13 |
0.000 |
2 |
0.006 |
|
|
|
|
|
|
|
|
|
|
|
| Fatty acid elongation and wax and cutin metabolism |
AcylLipid |
12 |
0.003 |
2 |
0.276 |
|
|
|
|
|
|
|
|
|
|
|
| biosynthesis of secondary products derived from primary amino acids |
FunCat |
11 |
0.000 |
3 |
0.000 |
|
|
|
|
|
|
|
|
|
|
|
| detoxification involving cytochrome P450 |
FunCat |
11 |
0.000 |
2 |
0.001 |
|
|
|
|
|
|
|
|
|
|
|
| Arginine and proline metabolism |
KEGG |
11 |
0.000 |
2 |
0.068 |
|
|
|
|
|
|
|
|
|
|
|
|
|
|
|
|
|
|
|
|
|
|
|
|
|
|
|
|
|
|
|
|
|
|
|
|
|
|
|
|
|
|
|
|
|
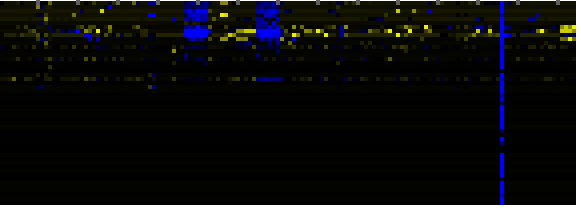
| Pathways co-expressed in the Hormone etc. data set (with more than 6 annotation points) |
|
CYP716A2 (At5g36140) |
|
|
|
|
|
|
|
|
| max. difference between log2-ratios: |
2.7 |
|
|
|
|
|
|
|
|
|
|
|
|
| max. difference between log2-ratios excluding lowest and highest 5%: |
1.4 |
|
|
|
|
|
|
|
|
|
|
|
|
| Pathway |
Source |
Scores of Genes |
p[Score] |
No. of Genes |
p[genes] |
Link to hormones etc. heatmap |
|
|
|
|
|
|
|
| transport |
FunCat |
12 |
0.000 |
2 |
0.000 |

|
|
|
|
|
|
| transport facilitation |
FunCat |
12 |
0.000 |
2 |
0.000 |
|
|
|
|
|
| transported compounds (substrates) |
FunCat |
12 |
0.000 |
2 |
0.000 |
|
|
|
|
|
| Transporters required for plastid development |
BioPath |
10 |
0.000 |
1 |
0.000 |
|
|
|
|
|
|
|
|
|
|
|
| iron ion homeostasis |
TAIR-GO |
10 |
0.000 |
1 |
0.000 |
|
|
|
|
|
|
|
|
|
|
|
| cation transport (Na, K, Ca , NH4, etc.) |
FunCat |
10 |
0.000 |
1 |
0.000 |
|
|
|
|
|
|
|
|
|
|
|
| heavy metal ion transport (Cu, Fe, etc.) |
FunCat |
10 |
0.000 |
1 |
0.000 |
|
|
|
|
|
|
|
|
|
|
|
| ion transport |
FunCat |
10 |
0.000 |
1 |
0.000 |
|
|
|
|
|
|
|
|
|
|
|
| Leaf Glycerolipid Biosynthesis |
BioPath |
7 |
0.001 |
1 |
0.038 |
|
|
|
|
|
|
|
|
|
|
|
| Leaf Glycerolipid Biosynthesis in Plastid |
BioPath |
7 |
0.000 |
1 |
0.004 |
|
|
|
|
|
|
|
|
|
|
|
| fatty acid desaturation |
TAIR-GO |
7 |
0.000 |
1 |
0.000 |
|
|
|
|
|
|
|
|
|
|
|
| photoinhibition |
TAIR-GO |
7 |
0.000 |
1 |
0.000 |
|
|
|
|
|
|
|
|
|
|
|
| glycosylglyceride desaturation pathway |
AraCyc |
7 |
0.000 |
1 |
0.000 |
|
|
|
|
|
|
|
|
|
|
|
| Synthesis of membrane lipids in plastids |
AcylLipid |
7 |
0.000 |
1 |
0.001 |
|
|
|
|
|
|
|
|
|
|
|
|
|
|
|
|
|
|
|
|
|
|
|
|
|
|
|
|
|
|
|
|
|
|
|
|
|
|
|
|
|
|
|
|
|
|
|
|
|
|
|
|
|
|
|
|
|
|
|
|
|
|
| Pathways co-expressed in the Mutant data set (with more than 19 annotation points) |
|
CYP716A2 (At5g36140) |
|
|
|
|
|
|
|
|
| max. difference between log2-ratios: |
7.0 |
|
|
|
|
|
|
|
|
|
|
|
|
| max. difference between log2-ratios excluding lowest and highest 5%: |
2.1 |
|
|
|
|
|
|
|
|
|
|
|
|
| Pathway |
Source |
Scores of Genes |
p[Score] |
No. of Genes |
p[genes] |
Link to mutants heatmap |
|
|
|
|
|
|
|
| Cell Wall Carbohydrate Metabolism |
BioPath |
125.5 |
0.000 |
39 |
0.000 |
|
|
|
|
| pectin metabolism |
BioPath |
66.5 |
0.000 |
29 |
0.000 |
|
|
|
| triterpene, sterol, and brassinosteroid metabolism |
LitPath |
57 |
0.000 |
12 |
0.006 |
|
|
|
| Starch and sucrose metabolism |
KEGG |
41 |
0.000 |
7 |
0.008 |
|
|
|
| Biosynthesis of steroids |
KEGG |
37 |
0.000 |
7 |
0.000 |
|
|
|
| intracellular signalling |
FunCat |
35 |
0.000 |
7 |
0.007 |
|
|
|
| Lipid signaling |
AcylLipid |
31 |
0.002 |
6 |
0.252 |
|
|
|
| Pyruvate metabolism |
KEGG |
29 |
0.000 |
6 |
0.021 |
|
|
|
| nucleotide metabolism |
FunCat |
28 |
0.000 |
6 |
0.000 |
|
|
|
| biogenesis of cell wall |
FunCat |
26 |
0.000 |
10 |
0.000 |
|
|
|
| lipases pathway |
AraCyc |
25 |
0.000 |
4 |
0.006 |
|
|
|
| mono-/sesqui-/di-terpene biosynthesis |
LitPath |
25 |
0.000 |
5 |
0.062 |
|
|
|
| terpenoid metabolism |
LitPath |
25 |
0.000 |
5 |
0.071 |
|
|
|
| triterpene biosynthesis |
LitPath |
25 |
0.000 |
4 |
0.001 |
|
|
|
|
|
|
|
|
|
|
|
| Nucleotide Metabolism |
KEGG |
24 |
0.000 |
5 |
0.075 |
|
|
|
|
|
|
|
|
|
|
|
| Pyrimidine metabolism |
KEGG |
24 |
0.000 |
5 |
0.004 |
|
|
|
|
|
|
|
|
|
|
|
| Leaf Glycerolipid Biosynthesis in Plastid |
BioPath |
22 |
0.025 |
3 |
0.439 |
|
|
|
|
|
|
|
|
|
|
|
| pentacyclic triterpenoid biosynthesis |
TAIR-GO |
21 |
0.000 |
3 |
0.000 |
|
|
|
|
|
|
|
|
|
|
|
| cellular response to phosphate starvation |
TAIR-GO |
20 |
0.000 |
2 |
0.001 |
|
|
|
|
|
|
|
|
|
|
|
| lipid biosynthesis |
TAIR-GO |
20 |
0.000 |
2 |
0.000 |
|
|
|
|
|
|
|
|
|
|
|
| (deoxy)ribose phosphate degradation |
AraCyc |
20 |
0.000 |
4 |
0.000 |
|
|
|
|
|
|
|
|
|
|
|
| glycosylglyceride biosynthesis |
AraCyc |
20 |
0.000 |
2 |
0.003 |
|
|
|
|
|
|
|
|
|
|
|
| energy |
FunCat |
20 |
0.000 |
3 |
0.000 |
|
|
|
|
|
|
|
|
|
|
|
| lipid, fatty acid and isoprenoid biosynthesis |
FunCat |
20 |
0.045 |
4 |
0.144 |
|
|
|
|
|
|
|
|
|
|
|
| lipid, fatty acid and isoprenoid metabolism |
FunCat |
20 |
0.006 |
2 |
0.367 |
|
|
|
|
|
|
|
|
|
|
|
| metabolism of energy reserves (e.g. glycogen, trehalose) |
FunCat |
20 |
0.000 |
3 |
0.000 |
|
|
|
|
|
|
|
|
|
|
|
| pyrimidine nucleotide metabolism |
FunCat |
20 |
0.000 |
4 |
0.001 |
|
|
|
|
|
|
|
|
|
|
|
| Glycolysis / Gluconeogenesis |
KEGG |
20 |
0.020 |
5 |
0.079 |
|
|
|
|
|
|
|
|
|
|
|
| Synthesis of membrane lipids in plastids |
AcylLipid |
20 |
0.000 |
2 |
0.038 |
|
|
|
|
|
|
|
|
|
|
|
|
|
|
|
|
|
|
|
|
|
|
|
|
|
|
|
|