|
|
|
|
|
|
|
|
|
|
|
|
|
|
|
|
|
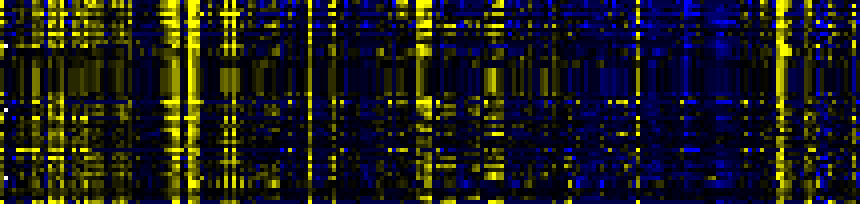
| Pathways co-expressed in the Stress data set ( with more than 15 annotation points) |
|
CYP71A13 (At2g30770) |
|
|
|
|
|
|
|
|
| max. difference between log2-ratios: |
11.2 |
|
|
|
|
|
|
|
|
|
|
|
|
| max. difference between log2-ratios excluding lowest and highest 5%: |
6.4 |
|
|
|
|
|
|
|
|
|
|
|
|
| Pathway |
Source |
Scores of Genes |
p[Score] |
No. of Genes |
p[genes] |
Link to stress heatmap |
|
|
|
|
|
|
|
| Phenylpropanoid Metabolism |
BioPath |
117 |
0.000 |
16 |
0.000 |
|
| Aromatic amino acid (Phe, Tyr, Trp) metabolism |
BioPath |
94 |
0.000 |
12 |
0.000 |
| Shikimate pathway |
LitPath |
94 |
0.000 |
12 |
0.000 |
| tryptophan biosynthesis |
TAIR-GO |
88 |
0.000 |
11 |
0.000 |
| Trp biosyntesis |
LitPath |
88 |
0.000 |
11 |
0.000 |
| Intermediary Carbon Metabolism |
BioPath |
78 |
0.000 |
17 |
0.000 |
| tryptophan biosynthesis |
AraCyc |
78 |
0.000 |
10 |
0.000 |
| Phenylalanine, tyrosine and tryptophan biosynthesis |
KEGG |
74 |
0.000 |
9 |
0.000 |
| Biosynthesis of Amino Acids and Derivatives |
BioPath |
64 |
0.000 |
10 |
0.015 |
| C-compound and carbohydrate metabolism |
FunCat |
60.5 |
0.000 |
15 |
0.000 |
| response to pathogenic bacteria |
TAIR-GO |
54 |
0.000 |
8 |
0.000 |
| amino acid metabolism |
FunCat |
50 |
0.000 |
7 |
0.003 |
| Glutathione metabolism |
KEGG |
50 |
0.000 |
8 |
0.000 |
| Gluconeogenesis from lipids in seeds |
BioPath |
46 |
0.000 |
6 |
0.005 |
|
|
|
|
|
|
|
|
|
|
|
| Citrate cycle (TCA cycle) |
KEGG |
44 |
0.000 |
10 |
0.000 |
|
|
|
|
|
|
|
|
|
|
|
| toxin catabolism |
TAIR-GO |
42 |
0.000 |
9 |
0.000 |
|
|
|
|
|
|
|
|
|
|
|
| Glutathione metabolism |
BioPath |
40 |
0.000 |
6 |
0.006 |
|
|
|
|
|
|
|
|
|
|
|
| Stilbene, coumarine and lignin biosynthesis |
KEGG |
37 |
0.000 |
8 |
0.006 |
|
|
|
|
|
|
|
|
|
|
|
| tricarboxylic-acid pathway (citrate cycle, Krebs cycle, TCA cycle) |
FunCat |
34 |
0.000 |
9 |
0.000 |
|
|
|
|
|
|
|
|
|
|
|
| glycolysis and gluconeogenesis |
FunCat |
30.5 |
0.000 |
7 |
0.006 |
|
|
|
|
|
|
|
|
|
|
|
| Fatty acid metabolism |
KEGG |
30 |
0.000 |
3 |
0.027 |
|
|
|
|
|
|
|
|
|
|
|
| Miscellaneous acyl lipid metabolism |
AcylLipid |
26 |
0.000 |
6 |
0.053 |
|
|
|
|
|
|
|
|
|
|
|
| Arginine and proline metabolism |
KEGG |
24 |
0.000 |
4 |
0.013 |
|
|
|
|
|
|
|
|
|
|
|
| Carbon fixation |
KEGG |
24 |
0.002 |
4 |
0.070 |
|
|
|
|
|
|
|
|
|
|
|
| Phenylalanine metabolism |
KEGG |
24 |
0.000 |
6 |
0.028 |
|
|
|
|
|
|
|
|
|
|
|
| lipid, fatty acid and isoprenoid degradation |
FunCat |
22 |
0.000 |
3 |
0.004 |
|
|
|
|
|
|
|
|
|
|
|
| Glycolysis / Gluconeogenesis |
KEGG |
22 |
0.029 |
4 |
0.121 |
|
|
|
|
|
|
|
|
|
|
|
| Pyruvate metabolism |
KEGG |
22 |
0.029 |
4 |
0.098 |
|
|
|
|
|
|
|
|
|
|
|
| Degradation of storage lipids and straight fatty acids |
AcylLipid |
22 |
0.000 |
3 |
0.017 |
|
|
|
|
|
|
|
|
|
|
|
| leucine biosynthesis |
AraCyc |
20 |
0.000 |
5 |
0.000 |
|
|
|
|
|
|
|
|
|
|
|
| response to stress |
TAIR-GO |
19 |
0.000 |
2 |
0.000 |
|
|
|
|
|
|
|
|
|
|
|
| IAA biosynthesis |
AraCyc |
19 |
0.000 |
2 |
0.003 |
|
|
|
|
|
|
|
|
|
|
|
| lignin biosynthesis |
AraCyc |
18 |
0.000 |
3 |
0.028 |
|
|
|
|
|
|
|
|
|
|
|
| TCA cycle -- aerobic respiration |
AraCyc |
18 |
0.000 |
4 |
0.008 |
|
|
|
|
|
|
|
|
|
|
|
| TCA cycle variation VII |
AraCyc |
18 |
0.012 |
4 |
0.037 |
|
|
|
|
|
|
|
|
|
|
|
| TCA cycle variation VIII |
AraCyc |
18 |
0.000 |
4 |
0.009 |
|
|
|
|
|
|
|
|
|
|
|
| Glycine, serine and threonine metabolism |
KEGG |
18 |
0.000 |
3 |
0.033 |
|
|
|
|
|
|
|
|
|
|
|
| Propanoate metabolism |
KEGG |
18 |
0.000 |
3 |
0.018 |
|
|
|
|
|
|
|
|
|
|
|
| Ascorbate and aldarate metabolism |
KEGG |
17 |
0.000 |
2 |
0.052 |
|
|
|
|
|
|
|
|
|
|
|
| Fluorene degradation |
KEGG |
17 |
0.000 |
2 |
0.013 |
|
|
|
|
|
|
|
|
|
|
|
| gamma-Hexachlorocyclohexane degradation |
KEGG |
17 |
0.000 |
2 |
0.019 |
|
|
|
|
|
|
|
|
|
|
|
| defense response |
TAIR-GO |
16 |
0.000 |
2 |
0.024 |
|
|
|
|
|
|
|
|
|
|
|
| nitrogen compound metabolism |
TAIR-GO |
16 |
0.000 |
2 |
0.000 |
|
|
|
|
|
|
|
|
|
|
|
| asparagine biosynthesis I |
AraCyc |
16 |
0.000 |
2 |
0.001 |
|
|
|
|
|
|
|
|
|
|
|
| asparagine degradation I |
AraCyc |
16 |
0.000 |
2 |
0.007 |
|
|
|
|
|
|
|
|
|
|
|
| aspartate biosynthesis and degradation |
AraCyc |
16 |
0.000 |
2 |
0.000 |
|
|
|
|
|
|
|
|
|
|
|
| aspartate degradation I |
AraCyc |
16 |
0.000 |
2 |
0.030 |
|
|
|
|
|
|
|
|
|
|
|
| aspartate degradation II |
AraCyc |
16 |
0.000 |
2 |
0.008 |
|
|
|
|
|
|
|
|
|
|
|
| glutamine degradation III |
AraCyc |
16 |
0.000 |
2 |
0.002 |
|
|
|
|
|
|
|
|
|
|
|
| metabolism of the aspartate family |
FunCat |
16 |
0.000 |
2 |
0.001 |
|
|
|
|
|
|
|
|
|
|
|
|
|
|
|
|
|
|
|
|
|
|
|
|
|
|
|
|
|
|
|
|
|
|
|
|
|
|
|
|
|
|
|
|
|
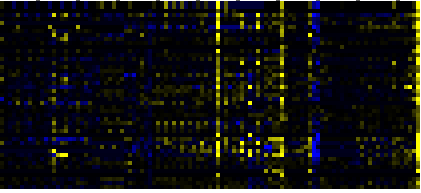
| Pathways co-expressed in the Hormone etc. data set (with more than 6 annotation points) |
|
CYP71A13 (At2g30770) |
|
|
|
|
|
|
|
|
| max. difference between log2-ratios: |
6.9 |
|
|
|
|
|
|
|
|
|
|
|
|
| max. difference between log2-ratios excluding lowest and highest 5%: |
2.0 |
|
|
|
|
|
|
|
|
|
|
|
|
| Pathway |
Source |
Scores of Genes |
p[Score] |
No. of Genes |
p[genes] |
Link to hormones etc. heatmap |
|
|
|
|
|
|
|
| Phenylpropanoid Metabolism |
BioPath |
33 |
0.000 |
5 |
0.011 |
|
|
|
|
|
|
| Gluconeogenesis from lipids in seeds |
BioPath |
29 |
0.000 |
4 |
0.001 |
|
|
|
|
|
| Degradation of storage lipids and straight fatty acids |
AcylLipid |
27 |
0.000 |
3 |
0.000 |
|
|
|
|
|
| lipid, fatty acid and isoprenoid degradation |
FunCat |
22 |
0.000 |
3 |
0.000 |
|
|
|
|
|
| Aromatic amino acid (Phe, Tyr, Trp) metabolism |
BioPath |
20 |
0.000 |
2 |
0.023 |
|
|
|
|
|
| tryptophan biosynthesis |
TAIR-GO |
20 |
0.000 |
2 |
0.001 |
|
|
|
|
|
| Fatty acid metabolism |
KEGG |
20 |
0.000 |
2 |
0.004 |
|
|
|
|
|
| Shikimate pathway |
LitPath |
20 |
0.000 |
2 |
0.017 |
|
|
|
|
|
| Trp biosyntesis |
LitPath |
20 |
0.000 |
2 |
0.001 |
|
|
|
|
|
| fatty acid beta oxidation complex |
BioPath |
19 |
0.000 |
3 |
0.000 |
|
|
|
|
|
| hypersensitive response |
TAIR-GO |
14 |
0.000 |
2 |
0.000 |
|
|
|
|
|
| amino acid metabolism |
FunCat |
14 |
0.000 |
2 |
0.058 |
|
|
|
|
|
| core phenylpropanoid metabolism |
BioPath |
12 |
0.000 |
2 |
0.013 |
|
|
|
|
|
|
|
|
|
|
|
| Phenylalanine, tyrosine and tryptophan biosynthesis |
KEGG |
12 |
0.000 |
2 |
0.009 |
|
|
|
|
|
|
|
|
|
|
|
| Phenylpropanoid pathway |
LitPath |
12 |
0.010 |
2 |
0.100 |
|
|
|
|
|
|
|
|
|
|
|
| Stilbene, coumarine and lignin biosynthesis |
KEGG |
11 |
0.000 |
3 |
0.016 |
|
|
|
|
|
|
|
|
|
|
|
| Regulatory enzymes |
BioPath |
10 |
0.000 |
1 |
0.000 |
|
|
|
|
|
|
|
|
|
|
|
| carotenoid biosynthesis |
TAIR-GO |
10 |
0.000 |
1 |
0.004 |
|
|
|
|
|
|
|
|
|
|
|
| fatty acid metabolism |
TAIR-GO |
10 |
0.000 |
1 |
0.036 |
|
|
|
|
|
|
|
|
|
|
|
| long-chain fatty acid metabolism |
TAIR-GO |
10 |
0.000 |
1 |
0.017 |
|
|
|
|
|
|
|
|
|
|
|
| plastid organization and biogenesis |
TAIR-GO |
10 |
0.000 |
1 |
0.001 |
|
|
|
|
|
|
|
|
|
|
|
| response to bacteria |
TAIR-GO |
10 |
0.000 |
1 |
0.000 |
|
|
|
|
|
|
|
|
|
|
|
| response to high light intensity |
TAIR-GO |
10 |
0.000 |
1 |
0.000 |
|
|
|
|
|
|
|
|
|
|
|
| response to temperature |
TAIR-GO |
10 |
0.000 |
1 |
0.000 |
|
|
|
|
|
|
|
|
|
|
|
| mixed acid fermentation |
AraCyc |
10 |
0.000 |
1 |
0.043 |
|
|
|
|
|
|
|
|
|
|
|
| sorbitol fermentation |
AraCyc |
10 |
0.001 |
1 |
0.130 |
|
|
|
|
|
|
|
|
|
|
|
| tryptophan biosynthesis |
AraCyc |
10 |
0.000 |
1 |
0.025 |
|
|
|
|
|
|
|
|
|
|
|
| biogenesis of cell wall |
FunCat |
10 |
0.000 |
1 |
0.105 |
|
|
|
|
|
|
|
|
|
|
|
| metabolism of the cysteine - aromatic group |
FunCat |
10 |
0.000 |
1 |
0.003 |
|
|
|
|
|
|
|
|
|
|
|
| Accessory protein/regulatory protein |
LitPath |
10 |
0.000 |
1 |
0.000 |
|
|
|
|
|
|
|
|
|
|
|
| ethylene biosynthesis |
TAIR-GO |
9 |
0.000 |
1 |
0.004 |
|
|
|
|
|
|
|
|
|
|
|
| acrylonitrile degradation |
AraCyc |
9 |
0.000 |
1 |
0.001 |
|
|
|
|
|
|
|
|
|
|
|
| aldoxime degradation |
AraCyc |
9 |
0.000 |
1 |
0.001 |
|
|
|
|
|
|
|
|
|
|
|
| IAA biosynthesis |
AraCyc |
9 |
0.000 |
1 |
0.005 |
|
|
|
|
|
|
|
|
|
|
|
| IAA biosynthesis I |
AraCyc |
9 |
0.000 |
1 |
0.003 |
|
|
|
|
|
|
|
|
|
|
|
| nitrogen and sulfur utilization |
FunCat |
9 |
0.000 |
1 |
0.004 |
|
|
|
|
|
|
|
|
|
|
|
| Benzoate degradation via CoA ligation |
KEGG |
9 |
0.001 |
1 |
0.224 |
|
|
|
|
|
|
|
|
|
|
|
| Cyanoamino acid metabolism |
KEGG |
9 |
0.000 |
1 |
0.025 |
|
|
|
|
|
|
|
|
|
|
|
| Nitrogen metabolism |
KEGG |
9 |
0.000 |
1 |
0.040 |
|
|
|
|
|
|
|
|
|
|
|
| Nucleotide Metabolism |
KEGG |
9 |
0.002 |
1 |
0.176 |
|
|
|
|
|
|
|
|
|
|
|
| Pyrimidine metabolism |
KEGG |
9 |
0.000 |
1 |
0.060 |
|
|
|
|
|
|
|
|
|
|
|
| Tryptophan metabolism |
KEGG |
9 |
0.000 |
1 |
0.045 |
|
|
|
|
|
|
|
|
|
|
|
| ascorbic acid biosynthesis |
BioPath |
8 |
0.000 |
2 |
0.002 |
|
|
|
|
|
|
|
|
|
|
|
| 4-hydroxyproline degradation |
AraCyc |
8 |
0.000 |
1 |
0.005 |
|
|
|
|
|
|
|
|
|
|
|
| arginine degradation IX |
AraCyc |
8 |
0.000 |
1 |
0.005 |
|
|
|
|
|
|
|
|
|
|
|
| proline degradation I |
AraCyc |
8 |
0.000 |
1 |
0.018 |
|
|
|
|
|
|
|
|
|
|
|
| proline degradation II |
AraCyc |
8 |
0.000 |
1 |
0.005 |
|
|
|
|
|
|
|
|
|
|
|
| fatty acid beta-oxidation |
TAIR-GO |
7 |
0.000 |
1 |
0.002 |
|
|
|
|
|
|
|
|
|
|
|
| indole phytoalexin biosynthesis |
TAIR-GO |
7 |
0.000 |
1 |
0.000 |
|
|
|
|
|
|
|
|
|
|
|
| L-serine biosynthesis |
TAIR-GO |
7 |
0.000 |
1 |
0.000 |
|
|
|
|
|
|
|
|
|
|
|
|
|
|
|
|
|
|
|
|
|
|
|
|
|
|
|
|
|
|
|
|
|
|
|
|
|
|
|
|
|
|
|
|
|
|
|
|
|
|
|
|
|
|
|
|
|
|
|
|
|
|
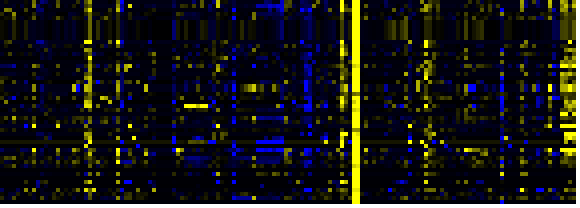
| Pathways co-expressed in the Mutant data set (with more than 6 annotation points) |
|
CYP71A13 (At2g30770) |
|
|
|
|
|
|
|
|
| max. difference between log2-ratios: |
7.8 |
|
|
|
|
|
|
|
|
|
|
|
|
| max. difference between log2-ratios excluding lowest and highest 5%: |
3.0 |
|
|
|
|
|
|
|
|
|
|
|
|
| Pathway |
Source |
Scores of Genes |
p[Score] |
No. of Genes |
p[genes] |
Link to mutants heatmap |
|
|
|
|
|
|
|
| Shikimate pathway |
LitPath |
78 |
0.000 |
10 |
0.000 |
|
|
|
|
| Phenylpropanoid Metabolism |
BioPath |
75 |
0.000 |
11 |
0.000 |
|
|
|
| tryptophan biosynthesis |
TAIR-GO |
74 |
0.000 |
9 |
0.000 |
|
|
|
| Trp biosyntesis |
LitPath |
74 |
0.000 |
9 |
0.000 |
|
|
|
| Aromatic amino acid (Phe, Tyr, Trp) metabolism |
BioPath |
72 |
0.000 |
9 |
0.000 |
|
|
|
| tryptophan biosynthesis |
AraCyc |
64 |
0.000 |
8 |
0.000 |
|
|
|
| Phenylalanine, tyrosine and tryptophan biosynthesis |
KEGG |
48 |
0.000 |
6 |
0.000 |
|
|
|
| response to pathogenic bacteria |
TAIR-GO |
44 |
0.000 |
6 |
0.000 |
|
|
|
| response to wounding |
TAIR-GO |
16 |
0.000 |
2 |
0.003 |
|
|
|
| Stilbene, coumarine and lignin biosynthesis |
KEGG |
13 |
0.000 |
3 |
0.040 |
|
|
|
| cellulose biosynthesis |
BioPath |
12 |
0.000 |
2 |
0.013 |
|
|
|
| Alanine and aspartate metabolism |
KEGG |
12 |
0.000 |
2 |
0.007 |
|
|
|
| beta-Alanine metabolism |
KEGG |
12 |
0.000 |
2 |
0.002 |
|
|
|
| Butanoate metabolism |
KEGG |
12 |
0.000 |
2 |
0.004 |
|
|
|
|
|
|
|
|
|
|
|
| Glutamate metabolism |
KEGG |
12 |
0.000 |
2 |
0.018 |
|
|
|
|
|
|
|
|
|
|
|
| Phenylalanine metabolism |
KEGG |
12 |
0.000 |
3 |
0.026 |
|
|
|
|
|
|
|
|
|
|
|
| Taurine and hypotaurine metabolism |
KEGG |
12 |
0.000 |
2 |
0.000 |
|
|
|
|
|
|
|
|
|
|
|
| Benzoate degradation via CoA ligation |
KEGG |
11 |
0.003 |
2 |
0.110 |
|
|
|
|
|
|
|
|
|
|
|
| Inositol phosphate metabolism |
KEGG |
11 |
0.006 |
2 |
0.133 |
|
|
|
|
|
|
|
|
|
|
|
| Nicotinate and nicotinamide metabolism |
KEGG |
11 |
0.001 |
2 |
0.091 |
|
|
|
|
|
|
|
|
|
|
|
| anthranilate synthase complex |
TAIR-GO |
10 |
0.000 |
1 |
0.000 |
|
|
|
|
|
|
|
|
|
|
|
| alanine biosynthesis II |
AraCyc |
10 |
0.000 |
2 |
0.000 |
|
|
|
|
|
|
|
|
|
|
|
| phenylalanine biosynthesis II |
AraCyc |
10 |
0.000 |
2 |
0.000 |
|
|
|
|
|
|
|
|
|
|
|
| amino acid metabolism |
FunCat |
10 |
0.000 |
1 |
0.076 |
|
|
|
|
|
|
|
|
|
|
|
| metabolism of the cysteine - aromatic group |
FunCat |
10 |
0.000 |
1 |
0.001 |
|
|
|
|
|
|
|
|
|
|
|
| N-terminal protein myristoylation |
TAIR-GO |
9 |
0.000 |
1 |
0.009 |
|
|
|
|
|
|
|
|
|
|
|
| Glycan Biosynthesis and Metabolism |
KEGG |
9 |
0.008 |
2 |
0.049 |
|
|
|
|
|
|
|
|
|
|
|
| hemicellulose biosynthesis |
BioPath |
8 |
0.000 |
1 |
0.013 |
|
|
|
|
|
|
|
|
|
|
|
| toxin catabolism |
TAIR-GO |
8 |
0.000 |
4 |
0.000 |
|
|
|
|
|
|
|
|
|
|
|
| Fructose and mannose metabolism |
KEGG |
8 |
0.009 |
1 |
0.121 |
|
|
|
|
|
|
|
|
|
|
|
| Glycerolipid metabolism |
KEGG |
8 |
0.002 |
1 |
0.069 |
|
|
|
|
|
|
|
|
|
|
|
| Lipid signaling |
AcylLipid |
8 |
0.025 |
3 |
0.069 |
|
|
|
|
|
|
|
|
|
|
|
| Miscellaneous acyl lipid metabolism |
AcylLipid |
8 |
0.013 |
3 |
0.088 |
|
|
|
|
|
|
|
|
|
|
|
| defense response |
TAIR-GO |
7 |
0.002 |
1 |
0.030 |
|
|
|
|
|
|
|
|
|
|
|
| indole phytoalexin biosynthesis |
TAIR-GO |
7 |
0.000 |
1 |
0.000 |
|
|
|
|
|
|
|
|
|
|
|
| salicylic acid biosynthesis |
TAIR-GO |
7 |
0.000 |
1 |
0.000 |
|
|
|
|
|
|
|
|
|
|
|
| camalexin biosynthesis |
AraCyc |
7 |
0.000 |
1 |
0.000 |
|
|
|
|
|
|
|
|
|
|
|
| Ascorbate and aldarate metabolism |
KEGG |
7 |
0.002 |
1 |
0.042 |
|
|
|
|
|
|
|
|
|
|
|
| Fluorene degradation |
KEGG |
7 |
0.000 |
1 |
0.016 |
|
|
|
|
|
|
|
|
|
|
|
| gamma-Hexachlorocyclohexane degradation |
KEGG |
7 |
0.000 |
1 |
0.020 |
|
|
|
|
|
|
|
|
|
|
|
| camalexin biosynthesis |
LitPath |
7 |
0.000 |
1 |
0.000 |
|
|
|
|
|
|
|
|
|
|
|
|
|
|
|
|
|
|
|
|
|
|
|
|
|
|
|
|