| _________________________________________ |
|
|
|
|
|
|
|
|
|
|
|
|
|
|
|
|
| Pathways co-expressed in the 3 applicable data sets (with more than 6 annotation points each) |
|
Find below a list of pathways that are co-expressed with the bait. First a list of pathways is given that are co-expressed in all data sets. Lists for each individual dataset are shown underneath. Depending on the number of co-expressed pathways only the top scoring pathways are given; all data can be saved as text using the link above. |

|
|
|
|
|
|
|
|
| Pathway |
Source |
Sum of scores |
Sum of genes |
|
|
|
|
|
|
|
|
| triterpene, sterol, and brassinosteroid metabolism |
LitPath |
80 |
15 |
|
|
|
|
|
|
|
|
| Biosynthesis of steroids |
KEGG |
72 |
11 |
|
|
|
|
|
|
|
|
| triterpene biosynthesis |
LitPath |
54 |
8 |
|
|
|
|
|
|
|
|
| isoprenoid biosynthesis |
FunCat |
47 |
10 |
|
To the right of each table a thumbnail of the actual co-expression heatmap is given. Klick on the link to see the heatmap containing all co-expressed genes. |
|
|
|
|
|
|
|
|
|
| lipid, fatty acid and isoprenoid biosynthesis |
FunCat |
47 |
10 |
|
|
|
|
|
|
|
|
|
|
| pentacyclic triterpenoid biosynthesis |
TAIR-GO |
42 |
6 |
|
|
|
|
|
|
|
|
|
|
| secondary metabolism |
FunCat |
41 |
9 |
|
For more information on how these pathway maps were generated please read the methods page |
|
|
|
|
|
|
|
|
|
|
|
|
|
|
|
|
|
|
|
|
|
|
|
|
|
|
|
|
|
|
|
|
|
|
|
|
|
|
|
|
|
|
|
|
|
|
|
|
|
|
|
|
|
|
|
|
|
|
|
|
|
|
|
|
|
|
|
|
|
|
|
|
|
|
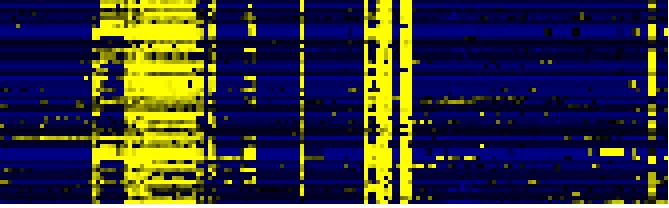
| Pathways co-expressed in the Organ and Tissue data set (with more than 10 annotation points) |
|
CYP71A16 (At5g42590) |
|
|
|
|
|
|
|
|
| max. difference between log2-ratios: |
5.7 |
|
|
|
|
|
|
|
|
|
|
|
|
| max. difference between log2-ratios excluding lowest and highest 5%: |
4.2 |
|
|
|
|
|
|
|
|
|
|
|
|
| Pathway |
Source |
Scores of Genes |
p[Score] |
No. of Genes |
p[genes] |
Link to organ heatmap |
|
|
|
|
|
|
|
| Stilbene, coumarine and lignin biosynthesis |
KEGG |
54 |
0.000 |
21 |
0.000 |
|
|
|
| Methane metabolism |
KEGG |
48 |
0.000 |
21 |
0.000 |
|
|
| Phenylalanine metabolism |
KEGG |
44 |
0.000 |
20 |
0.000 |
|
|
| Prostaglandin and leukotriene metabolism |
KEGG |
44 |
0.000 |
20 |
0.000 |
|
|
| Phenylpropanoid Metabolism |
BioPath |
30 |
0.000 |
7 |
0.000 |
|
|
| mono-/sesqui-/di-terpene biosynthesis |
LitPath |
27 |
0.000 |
4 |
0.006 |
|
|
| terpenoid metabolism |
LitPath |
27 |
0.000 |
4 |
0.006 |
|
|
| triterpene, sterol, and brassinosteroid metabolism |
LitPath |
26 |
0.000 |
6 |
0.012 |
|
|
| detoxification |
FunCat |
23 |
0.000 |
8 |
0.000 |
|
|
| isoprenoid biosynthesis |
FunCat |
22 |
0.000 |
5 |
0.001 |
|
|
| lipid, fatty acid and isoprenoid biosynthesis |
FunCat |
22 |
0.000 |
5 |
0.000 |
|
|
| Glucosyltransferases for benzoic acids |
BioPath |
20 |
0.000 |
2 |
0.000 |
|
|
| Biosynthesis of steroids |
KEGG |
20 |
0.000 |
3 |
0.040 |
|
|
| triterpene biosynthesis |
LitPath |
20 |
0.000 |
3 |
0.000 |
|
|
|
|
|
|
|
|
|
|
|
| monoterpenoid biosynthesis |
TAIR-GO |
19 |
0.000 |
2 |
0.000 |
|
|
|
|
|
|
|
|
|
|
|
| monoterpene biosynthesis |
LitPath |
19 |
0.000 |
2 |
0.001 |
|
|
|
|
|
|
|
|
|
|
|
| Cell Wall Carbohydrate Metabolism |
BioPath |
18 |
0.026 |
4 |
0.272 |
|
|
|
|
|
|
|
|
|
|
|
| Fatty acid elongation and wax and cutin metabolism |
AcylLipid |
18 |
0.000 |
3 |
0.051 |
|
|
|
|
|
|
|
|
|
|
|
| Lipid signaling |
AcylLipid |
18 |
0.012 |
3 |
0.414 |
|
|
|
|
|
|
|
|
|
|
|
| secondary metabolism |
FunCat |
17 |
0.000 |
4 |
0.003 |
|
|
|
|
|
|
|
|
|
|
|
| lactose degradation IV |
AraCyc |
16 |
0.000 |
3 |
0.000 |
|
|
|
|
|
|
|
|
|
|
|
| flavonol biosynthesis |
AraCyc |
15 |
0.000 |
3 |
0.000 |
|
|
|
|
|
|
|
|
|
|
|
| pentacyclic triterpenoid biosynthesis |
TAIR-GO |
14 |
0.000 |
2 |
0.000 |
|
|
|
|
|
|
|
|
|
|
|
| toxin catabolism |
TAIR-GO |
12 |
0.000 |
6 |
0.000 |
|
|
|
|
|
|
|
|
|
|
|
| colanic acid building blocks biosynthesis |
AraCyc |
12 |
0.000 |
2 |
0.027 |
|
|
|
|
|
|
|
|
|
|
|
| dTDP-rhamnose biosynthesis |
AraCyc |
12 |
0.000 |
2 |
0.014 |
|
|
|
|
|
|
|
|
|
|
|
| galactose degradation I |
AraCyc |
12 |
0.000 |
2 |
0.000 |
|
|
|
|
|
|
|
|
|
|
|
| glucose conversion |
AraCyc |
12 |
0.000 |
2 |
0.011 |
|
|
|
|
|
|
|
|
|
|
|
| UDP-glucose conversion |
AraCyc |
12 |
0.000 |
2 |
0.010 |
|
|
|
|
|
|
|
|
|
|
|
| detoxification involving cytochrome P450 |
FunCat |
11 |
0.000 |
2 |
0.001 |
|
|
|
|
|
|
|
|
|
|
|
|
|
|
|
|
|
|
|
|
|
|
|
|
|
|
|
|
|
|
|
|
|
|
|
|
|
|
|
|
|
|
|
|
|
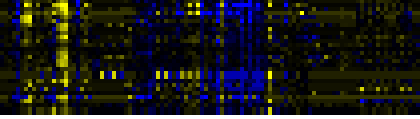
| Pathways co-expressed in the Hormone etc. data set (with more than 6 annotation points) |
|
CYP71A16 (At5g42590) |
|
|
|
|
|
|
|
|
| max. difference between log2-ratios: |
5.6 |
|
|
|
|
|
|
|
|
|
|
|
|
| max. difference between log2-ratios excluding lowest and highest 5%: |
2.3 |
|
|
|
|
|
|
|
|
|
|
|
|
| Pathway |
Source |
Scores of Genes |
p[Score] |
No. of Genes |
p[genes] |
Link to hormones etc. heatmap |
|
|
|
|
|
|
|
| Biosynthesis of steroids |
KEGG |
28 |
0.000 |
4 |
0.000 |
|
|
|
|
|
|
| triterpene, sterol, and brassinosteroid metabolism |
LitPath |
28 |
0.000 |
4 |
0.006 |
|
|
|
|
|
| Isoprenoid Biosynthesis in the Cytosol and in Mitochondria |
BioPath |
24 |
0.000 |
3 |
0.001 |
|
|
|
|
|
| sterol biosynthesis |
TAIR-GO |
24 |
0.000 |
3 |
0.000 |
|
|
|
|
|
| Cell Wall Carbohydrate Metabolism |
BioPath |
18 |
0.016 |
2 |
0.436 |
|
|
|
|
|
| Starch and sucrose metabolism |
KEGG |
18 |
0.000 |
2 |
0.003 |
|
|
|
|
|
| sterol biosynthesis |
BioPath |
14 |
0.000 |
2 |
0.001 |
|
|
|
|
|
| pentacyclic triterpenoid biosynthesis |
TAIR-GO |
14 |
0.000 |
2 |
0.000 |
|
|
|
|
|
| sterol biosynthesis |
AraCyc |
14 |
0.000 |
2 |
0.000 |
|
|
|
|
|
|
|
|
|
|
|
| triterpene biosynthesis |
LitPath |
14 |
0.000 |
2 |
0.001 |
|
|
|
|
|
|
|
|
|
|
|
| C-compound and carbohydrate metabolism |
FunCat |
12 |
0.022 |
2 |
0.212 |
|
|
|
|
|
|
|
|
|
|
|
| glycolysis and gluconeogenesis |
FunCat |
12 |
0.000 |
2 |
0.032 |
|
|
|
|
|
|
|
|
|
|
|
| Biosynthesis of prenyl diphosphates |
BioPath |
10 |
0.000 |
1 |
0.038 |
|
|
|
|
|
|
|
|
|
|
|
| sucrose metabolism |
BioPath |
10 |
0.000 |
1 |
0.008 |
|
|
|
|
|
|
|
|
|
|
|
| isoprenoid biosynthesis |
TAIR-GO |
10 |
0.000 |
1 |
0.000 |
|
|
|
|
|
|
|
|
|
|
|
| tryptophan catabolism |
TAIR-GO |
10 |
0.000 |
1 |
0.000 |
|
|
|
|
|
|
|
|
|
|
|
| glucosinolate biosynthesis from tryptophan |
AraCyc |
10 |
0.000 |
1 |
0.000 |
|
|
|
|
|
|
|
|
|
|
|
| IAA biosynthesis |
AraCyc |
10 |
0.000 |
1 |
0.000 |
|
|
|
|
|
|
|
|
|
|
|
| IAA biosynthesis I |
AraCyc |
10 |
0.000 |
1 |
0.000 |
|
|
|
|
|
|
|
|
|
|
|
| mevalonate pathway |
AraCyc |
10 |
0.000 |
1 |
0.001 |
|
|
|
|
|
|
|
|
|
|
|
| lipid, fatty acid and isoprenoid metabolism |
FunCat |
10 |
0.000 |
1 |
0.025 |
|
|
|
|
|
|
|
|
|
|
|
| Galactose metabolism |
KEGG |
10 |
0.000 |
1 |
0.007 |
|
|
|
|
|
|
|
|
|
|
|
| Glucosinolate Metabolism |
LitPath |
10 |
0.001 |
1 |
0.048 |
|
|
|
|
|
|
|
|
|
|
|
| IPP (isopentenyl diphosphate) and DMAPP (dimethylallyl diphosphat) biosynthesis |
LitPath |
10 |
0.000 |
1 |
0.053 |
|
|
|
|
|
|
|
|
|
|
|
| mevalonate pathway, cytosol |
LitPath |
10 |
0.000 |
1 |
0.017 |
|
|
|
|
|
|
|
|
|
|
|
| sterol biosynthesis |
LitPath |
10 |
0.000 |
1 |
0.002 |
|
|
|
|
|
|
|
|
|
|
|
| secondary metabolism |
FunCat |
9 |
0.000 |
2 |
0.005 |
|
|
|
|
|
|
|
|
|
|
|
| Leaf Glycerolipid Biosynthesis in Plastid |
BioPath |
8 |
0.003 |
2 |
0.007 |
|
|
|
|
|
|
|
|
|
|
|
| pectin metabolism |
BioPath |
8 |
0.005 |
1 |
0.290 |
|
|
|
|
|
|
|
|
|
|
|
| isoprenoid biosynthesis |
FunCat |
8 |
0.000 |
2 |
0.006 |
|
|
|
|
|
|
|
|
|
|
|
| lipid, fatty acid and isoprenoid biosynthesis |
FunCat |
8 |
0.000 |
2 |
0.004 |
|
|
|
|
|
|
|
|
|
|
|
| storage protein |
FunCat |
8 |
0.000 |
2 |
0.000 |
|
|
|
|
|
|
|
|
|
|
|
| Pentose and glucuronate interconversions |
KEGG |
8 |
0.000 |
1 |
0.002 |
|
|
|
|
|
|
|
|
|
|
|
| Lipid signaling |
AcylLipid |
8 |
0.004 |
2 |
0.050 |
|
|
|
|
|
|
|
|
|
|
|
| Synthesis of fatty acids in plastids |
AcylLipid |
8 |
0.000 |
2 |
0.002 |
|
|
|
|
|
|
|
|
|
|
|
|
|
|
|
|
|
|
|
|
|
|
|
|
|
|
|
|
|
|
|
|
|
|
|
|
|
|
|
|
|
|
|
|
|
|
|
|
|
|
|
|
|
|
|
|
|
|
|
|
|
|
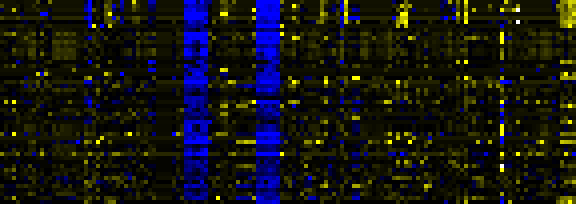
| Pathways co-expressed in the Mutant data set (with more than 10 annotation points) |
|
CYP71A16 (At5g42590) |
|
|
|
|
|
|
|
|
| max. difference between log2-ratios: |
6.8 |
|
|
|
|
|
|
|
|
|
|
|
|
| max. difference between log2-ratios excluding lowest and highest 5%: |
4.7 |
|
|
|
|
|
|
|
|
|
|
|
|
| Pathway |
Source |
Scores of Genes |
p[Score] |
No. of Genes |
p[genes] |
Link to mutants heatmap |
|
|
|
|
|
|
|
| Ribosome |
KEGG |
40 |
0.000 |
7 |
0.009 |
|
|
|
|
| Intermediary Carbon Metabolism |
BioPath |
34 |
0.000 |
5 |
0.007 |
|
|
|
| glycolysis and gluconeogenesis |
FunCat |
34 |
0.000 |
5 |
0.007 |
|
|
|
| triterpene, sterol, and brassinosteroid metabolism |
LitPath |
26 |
0.000 |
5 |
0.000 |
|
|
|
| Biosynthesis of steroids |
KEGG |
24 |
0.000 |
4 |
0.000 |
|
|
|
| Gluconeogenesis from lipids in seeds |
BioPath |
22 |
0.000 |
3 |
0.007 |
|
|
|
| Photosystems |
BioPath |
22 |
0.000 |
3 |
0.030 |
|
|
|
| acetate fermentation |
AraCyc |
22 |
0.000 |
3 |
0.003 |
|
|
|
| fructose degradation (anaerobic) |
AraCyc |
22 |
0.000 |
3 |
0.002 |
|
|
|
| glycerol degradation II |
AraCyc |
22 |
0.000 |
3 |
0.001 |
|
|
|
| glycolysis I |
AraCyc |
22 |
0.000 |
3 |
0.027 |
|
|
|
| glycolysis IV |
AraCyc |
22 |
0.000 |
3 |
0.002 |
|
|
|
| sorbitol fermentation |
AraCyc |
22 |
0.000 |
3 |
0.003 |
|
|
|
| Glycolysis / Gluconeogenesis |
KEGG |
22 |
0.000 |
3 |
0.012 |
|
|
|
|
|
|
|
|
|
|
|
| triterpene biosynthesis |
LitPath |
20 |
0.000 |
3 |
0.000 |
|
|
|
|
|
|
|
|
|
|
|
| isoprenoid biosynthesis |
FunCat |
17 |
0.000 |
3 |
0.012 |
|
|
|
|
|
|
|
|
|
|
|
| lipid, fatty acid and isoprenoid biosynthesis |
FunCat |
17 |
0.000 |
3 |
0.007 |
|
|
|
|
|
|
|
|
|
|
|
| additional photosystem II components |
BioPath |
16 |
0.000 |
2 |
0.009 |
|
|
|
|
|
|
|
|
|
|
|
| ATP synthase components |
BioPath |
16 |
0.000 |
2 |
0.000 |
|
|
|
|
|
|
|
|
|
|
|
| ATP synthesis coupled proton transport |
TAIR-GO |
16 |
0.000 |
2 |
0.000 |
|
|
|
|
|
|
|
|
|
|
|
| proton transport |
TAIR-GO |
16 |
0.000 |
2 |
0.000 |
|
|
|
|
|
|
|
|
|
|
|
| Calvin cycle |
AraCyc |
16 |
0.000 |
2 |
0.005 |
|
|
|
|
|
|
|
|
|
|
|
| gluconeogenesis |
AraCyc |
16 |
0.000 |
2 |
0.007 |
|
|
|
|
|
|
|
|
|
|
|
| glyceraldehyde 3-phosphate degradation |
AraCyc |
16 |
0.000 |
2 |
0.001 |
|
|
|
|
|
|
|
|
|
|
|
| Carbon fixation |
KEGG |
16 |
0.000 |
2 |
0.041 |
|
|
|
|
|
|
|
|
|
|
|
| secondary metabolism |
FunCat |
15 |
0.000 |
3 |
0.011 |
|
|
|
|
|
|
|
|
|
|
|
| pentacyclic triterpenoid biosynthesis |
TAIR-GO |
14 |
0.000 |
2 |
0.000 |
|
|
|
|
|
|
|
|
|
|
|
| Phenylalanine metabolism |
KEGG |
12 |
0.000 |
2 |
0.082 |
|
|
|
|
|
|
|
|
|
|
|
|
|
|
|
|
|
|
|
|
|
|
|
|
|
|
|
|