|
|
|
|
|
|
|
|
|
|
|
|
|
|
|
|
|
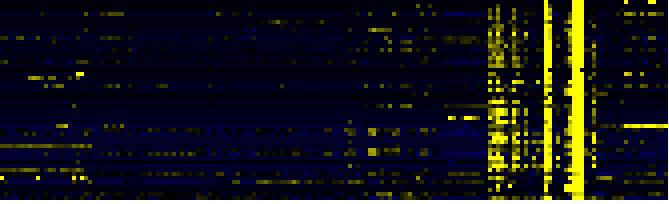
| Pathways co-expressed in the Organ and Tissue data set (with more than 10 annotation points) |
|
CYP71A18 (At1g11610) |
|
|
|
|
|
|
|
|
| max. difference between log2-ratios: |
6.0 |
|
|
|
|
|
|
|
|
|
|
|
|
| max. difference between log2-ratios excluding lowest and highest 5%: |
0.0 |
|
|
|
|
|
|
|
|
|
|
|
|
| Pathway |
Source |
Scores of Genes |
p[Score] |
No. of Genes |
p[genes] |
Link to organ heatmap |
|
|
|
|
|
|
|
| Lipid signaling |
AcylLipid |
52 |
0.000 |
12 |
0.000 |
|
|
|
| Cell Wall Carbohydrate Metabolism |
BioPath |
50 |
0.000 |
14 |
0.000 |
|
|
| Inositol phosphate metabolism |
KEGG |
32 |
0.000 |
9 |
0.000 |
|
|
| pectin metabolism |
BioPath |
28 |
0.000 |
9 |
0.000 |
|
|
| Synthesis of membrane lipids in endomembrane system |
AcylLipid |
24 |
0.000 |
3 |
0.138 |
|
|
| Leaf Glycerolipid Biosynthesis |
BioPath |
19 |
0.042 |
3 |
0.311 |
|
|
| Leaf Glycerolipid Biosynthesis in cytosol / ER |
BioPath |
19 |
0.000 |
3 |
0.001 |
|
|
| cellulose biosynthesis |
BioPath |
18 |
0.000 |
4 |
0.001 |
|
|
| Phosphatidylinositol signaling system |
KEGG |
18 |
0.000 |
3 |
0.003 |
|
|
| Signal Transduction |
KEGG |
18 |
0.000 |
3 |
0.003 |
|
|
| Glycan Biosynthesis and Metabolism |
KEGG |
17 |
0.000 |
2 |
0.093 |
|
|
| Intermediary Carbon Metabolism |
BioPath |
16 |
0.013 |
4 |
0.107 |
|
|
| Fructose and mannose metabolism |
KEGG |
16 |
0.000 |
3 |
0.008 |
|
|
|
|
|
|
|
|
|
|
|
| Benzoate degradation via CoA ligation |
KEGG |
14 |
0.000 |
6 |
0.001 |
|
|
|
|
|
|
|
|
|
|
|
| Nicotinate and nicotinamide metabolism |
KEGG |
14 |
0.000 |
6 |
0.000 |
|
|
|
|
|
|
|
|
|
|
|
| biogenesis of cell wall |
FunCat |
12 |
0.000 |
5 |
0.000 |
|
|
|
|
|
|
|
|
|
|
|
| glycolysis and gluconeogenesis |
FunCat |
12 |
0.004 |
3 |
0.086 |
|
|
|
|
|
|
|
|
|
|
|
|
|
|
|
|
|
|
|
|
|
|
|
|
|
|
|
|
|
|
|
|
|
|
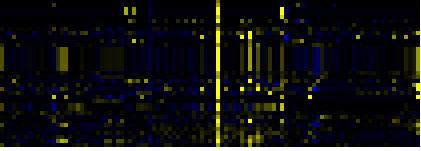
| Pathways co-expressed in the Hormone etc. data set (with more than 7 annotation points) |
|
CYP71A18 (At1g11610) |
|
|
|
|
|
|
|
|
| max. difference between log2-ratios: |
1.8 |
|
|
|
|
|
|
|
|
|
|
|
|
| max. difference between log2-ratios excluding lowest and highest 5%: |
0.0 |
|
|
|
|
|
|
|
|
|
|
|
|
| Pathway |
Source |
Scores of Genes |
p[Score] |
No. of Genes |
p[genes] |
Link to hormones etc. heatmap |
|
|
|
|
|
|
|
| Phenylpropanoid Metabolism |
BioPath |
50 |
0.000 |
8 |
0.000 |
|
|
|
|
|
|
| Aromatic amino acid (Phe, Tyr, Trp) metabolism |
BioPath |
48 |
0.000 |
7 |
0.000 |
|
|
|
|
|
| tryptophan biosynthesis |
TAIR-GO |
48 |
0.000 |
7 |
0.000 |
|
|
|
|
|
| tryptophan biosynthesis |
AraCyc |
48 |
0.000 |
7 |
0.000 |
|
|
|
|
|
| Shikimate pathway |
LitPath |
48 |
0.000 |
7 |
0.000 |
|
|
|
|
|
| Trp biosyntesis |
LitPath |
48 |
0.000 |
7 |
0.000 |
|
|
|
|
|
| response to pathogenic bacteria |
TAIR-GO |
38 |
0.000 |
6 |
0.000 |
|
|
|
|
|
| Phenylalanine, tyrosine and tryptophan biosynthesis |
KEGG |
22 |
0.000 |
3 |
0.001 |
|
|
|
|
|
| Stilbene, coumarine and lignin biosynthesis |
KEGG |
17 |
0.000 |
6 |
0.000 |
|
|
|
|
|
| Purine metabolism |
KEGG |
16 |
0.000 |
2 |
0.031 |
|
|
|
|
|
|
|
|
|
|
|
| Synthesis of membrane lipids in endomembrane system |
AcylLipid |
12 |
0.000 |
3 |
0.002 |
|
|
|
|
|
|
|
|
|
|
|
| Glutathione metabolism |
BioPath |
10 |
0.001 |
1 |
0.110 |
|
|
|
|
|
|
|
|
|
|
|
| sulfate assimilation |
TAIR-GO |
10 |
0.000 |
1 |
0.002 |
|
|
|
|
|
|
|
|
|
|
|
| dissimilatory sulfate reduction |
AraCyc |
10 |
0.000 |
1 |
0.001 |
|
|
|
|
|
|
|
|
|
|
|
| sulfate assimilation III |
AraCyc |
10 |
0.000 |
1 |
0.014 |
|
|
|
|
|
|
|
|
|
|
|
| biogenesis of chloroplast |
FunCat |
10 |
0.000 |
1 |
0.057 |
|
|
|
|
|
|
|
|
|
|
|
| nitrogen and sulfur utilization |
FunCat |
10 |
0.000 |
1 |
0.002 |
|
|
|
|
|
|
|
|
|
|
|
| Methane metabolism |
KEGG |
10 |
0.000 |
5 |
0.000 |
|
|
|
|
|
|
|
|
|
|
|
| Phenylalanine metabolism |
KEGG |
10 |
0.000 |
5 |
0.000 |
|
|
|
|
|
|
|
|
|
|
|
| Prostaglandin and leukotriene metabolism |
KEGG |
10 |
0.000 |
5 |
0.000 |
|
|
|
|
|
|
|
|
|
|
|
| Selenoamino acid metabolism |
KEGG |
10 |
0.000 |
1 |
0.046 |
|
|
|
|
|
|
|
|
|
|
|
| Sulfur metabolism |
KEGG |
10 |
0.000 |
1 |
0.026 |
|
|
|
|
|
|
|
|
|
|
|
|
|
|
|
|
|
|
|
|
|
|
|
|
|
|
|
|
|
|
|
|
|
|
|
|
|
|
|
|
|
|
|
|
|
|
|
|
|
|
|
|
|
|
|
|
|
|
|
|
|
|
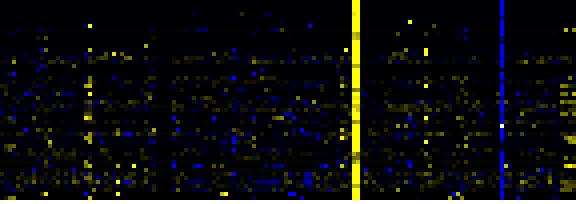
| Pathways co-expressed in the Mutant data set (with more than 20 annotation points) |
|
CYP71A18 (At1g11610) |
|
|
|
|
|
|
|
|
| max. difference between log2-ratios: |
10.2 |
|
|
|
|
|
|
|
|
|
|
|
|
| max. difference between log2-ratios excluding lowest and highest 5%: |
0.0 |
|
|
|
|
|
|
|
|
|
|
|
|
| Pathway |
Source |
Scores of Genes |
p[Score] |
No. of Genes |
p[genes] |
Link to mutants heatmap |
|
|
|
|
|
|
|
| Phenylpropanoid Metabolism |
BioPath |
93 |
0.000 |
17 |
0.033 |
|
|
|
|
| Lipid signaling |
AcylLipid |
87 |
0.000 |
22 |
0.000 |
|
|
|
| C-compound and carbohydrate metabolism |
FunCat |
79 |
0.006 |
19 |
0.193 |
|
|
|
| Biosynthesis of Amino Acids and Derivatives |
BioPath |
62 |
0.011 |
14 |
0.132 |
|
|
|
| pectin metabolism |
BioPath |
58.5 |
0.000 |
26 |
0.000 |
|
|
|
| response to pathogenic bacteria |
TAIR-GO |
54 |
0.000 |
7 |
0.000 |
|
|
|
| tryptophan biosynthesis |
AraCyc |
52 |
0.000 |
8 |
0.000 |
|
|
|
| Aromatic amino acid (Phe, Tyr, Trp) metabolism |
BioPath |
50 |
0.000 |
7 |
0.027 |
|
|
|
| tryptophan biosynthesis |
TAIR-GO |
50 |
0.000 |
7 |
0.000 |
|
|
|
| Shikimate pathway |
LitPath |
50 |
0.000 |
7 |
0.014 |
|
|
|
| Trp biosyntesis |
LitPath |
50 |
0.000 |
7 |
0.000 |
|
|
|
| Nucleotide Metabolism |
KEGG |
42 |
0.000 |
8 |
0.022 |
|
|
|
| Inositol phosphate metabolism |
KEGG |
40 |
0.000 |
11 |
0.006 |
|
|
|
| Purine metabolism |
KEGG |
40 |
0.000 |
7 |
0.016 |
|
|
|
|
|
|
|
|
|
|
|
| Phenylpropanoid pathway |
LitPath |
40 |
0.008 |
9 |
0.111 |
|
|
|
|
|
|
|
|
|
|
|
| lipases pathway |
AraCyc |
39 |
0.000 |
6 |
0.001 |
|
|
|
|
|
|
|
|
|
|
|
| nucleotide metabolism |
FunCat |
38 |
0.000 |
8 |
0.000 |
|
|
|
|
|
|
|
|
|
|
|
| Benzoate degradation via CoA ligation |
KEGG |
36 |
0.000 |
10 |
0.009 |
|
|
|
|
|
|
|
|
|
|
|
| Nicotinate and nicotinamide metabolism |
KEGG |
36 |
0.000 |
10 |
0.005 |
|
|
|
|
|
|
|
|
|
|
|
| Pyrimidine metabolism |
KEGG |
36 |
0.000 |
7 |
0.001 |
|
|
|
|
|
|
|
|
|
|
|
| core phenylpropanoid metabolism |
BioPath |
30 |
0.000 |
6 |
0.027 |
|
|
|
|
|
|
|
|
|
|
|
| Methionin/SAM/ethylene metabolism from cysteine and aspartate |
BioPath |
30 |
0.000 |
4 |
0.045 |
|
|
|
|
|
|
|
|
|
|
|
| lignin biosynthesis |
AraCyc |
30 |
0.000 |
5 |
0.044 |
|
|
|
|
|
|
|
|
|
|
|
| triacylglycerol degradation |
AraCyc |
30 |
0.000 |
11 |
0.000 |
|
|
|
|
|
|
|
|
|
|
|
| jasmonic acid biosynthesis |
AraCyc |
28 |
0.000 |
5 |
0.000 |
|
|
|
|
|
|
|
|
|
|
|
| energy |
FunCat |
28 |
0.000 |
6 |
0.000 |
|
|
|
|
|
|
|
|
|
|
|
| intracellular signalling |
FunCat |
28 |
0.000 |
7 |
0.018 |
|
|
|
|
|
|
|
|
|
|
|
| metabolism of energy reserves (e.g. glycogen, trehalose) |
FunCat |
28 |
0.000 |
6 |
0.000 |
|
|
|
|
|
|
|
|
|
|
|
| Phenylalanine, tyrosine and tryptophan biosynthesis |
KEGG |
28 |
0.000 |
4 |
0.085 |
|
|
|
|
|
|
|
|
|
|
|
| lipid, fatty acid and isoprenoid degradation |
FunCat |
27 |
0.000 |
4 |
0.023 |
|
|
|
|
|
|
|
|
|
|
|
| transcription |
FunCat |
27 |
0.000 |
7 |
0.000 |
|
|
|
|
|
|
|
|
|
|
|
| pyrimidine nucleotide metabolism |
FunCat |
26 |
0.000 |
5 |
0.000 |
|
|
|
|
|
|
|
|
|
|
|
| Propanoate metabolism |
KEGG |
26 |
0.000 |
4 |
0.022 |
|
|
|
|
|
|
|
|
|
|
|
| Transcription |
KEGG |
25 |
0.002 |
6 |
0.128 |
|
|
|
|
|
|
|
|
|
|
|
| jasmonic acid biosynthesis |
TAIR-GO |
24 |
0.000 |
4 |
0.001 |
|
|
|
|
|
|
|
|
|
|
|
| chlorophyll biosynthesis |
AraCyc |
24 |
0.006 |
5 |
0.087 |
|
|
|
|
|
|
|
|
|
|
|
| fructose degradation (anaerobic) |
AraCyc |
24 |
0.006 |
7 |
0.032 |
|
|
|
|
|
|
|
|
|
|
|
| sorbitol fermentation |
AraCyc |
24 |
0.012 |
7 |
0.041 |
|
|
|
|
|
|
|
|
|
|
|
| biosynthesis of proto- and siroheme |
AraCyc |
22 |
0.001 |
4 |
0.094 |
|
|
|
|
|
|
|
|
|
|
|
| trehalose biosynthesis II |
AraCyc |
22 |
0.005 |
5 |
0.100 |
|
|
|
|
|
|
|
|
|
|
|
| trehalose biosynthesis III |
AraCyc |
22 |
0.000 |
5 |
0.010 |
|
|
|
|
|
|
|
|
|
|
|
| defense response |
TAIR-GO |
21 |
0.000 |
3 |
0.010 |
|
|
|
|
|
|
|
|
|
|
|
| RNA synthesis |
FunCat |
21 |
0.000 |
5 |
0.005 |
|
|
|
|
|
|
|
|
|
|
|
|
|
|
|
|
|
|
|
|
|
|
|
|
|
|
|
|