|
|
|
|
|
|
|
|
|
|
|
|
|
|
|
|
|
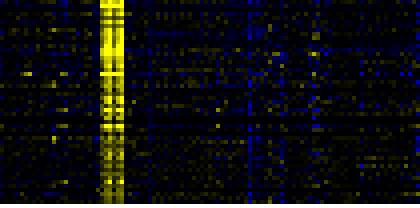
| Pathways co-expressed in the Hormone etc. data set (with more than 10 annotation points) |
|
CYP71B2 (At1g13080) |
|
|
|
|
|
|
|
|
| max. difference between log2-ratios: |
5.2 |
|
|
|
|
|
|
|
|
|
|
|
|
| max. difference between log2-ratios excluding lowest and highest 5%: |
2.6 |
|
|
|
|
|
|
|
|
|
|
|
|
| Pathway |
Source |
Scores of Genes |
p[Score] |
No. of Genes |
p[genes] |
Link to hormones etc. heatmap |
|
|
|
|
|
|
|
| Biosynthesis of Amino Acids and Derivatives |
BioPath |
50 |
0.000 |
8 |
0.033 |
|
|
|
|
|
|
| Plastidial Isoprenoids (Chlorophylls, Carotenoids, Tocopherols, Plastoquinone, Phylloquinone) |
BioPath |
44 |
0.000 |
5 |
0.024 |
|
|
|
|
|
| Glucosinolate Metabolism |
LitPath |
40 |
0.000 |
4 |
0.000 |
|
|
|
|
|
| Gluconeogenesis from lipids in seeds |
BioPath |
36 |
0.000 |
5 |
0.009 |
|
|
|
|
|
| Fatty acid elongation and wax and cutin metabolism |
AcylLipid |
36 |
0.000 |
8 |
0.001 |
|
|
|
|
|
| colanic acid building blocks biosynthesis |
AraCyc |
28 |
0.000 |
5 |
0.018 |
|
|
|
|
|
| amino acid metabolism |
FunCat |
26 |
0.008 |
3 |
0.186 |
|
|
|
|
|
| isoprenoid biosynthesis |
FunCat |
25 |
0.000 |
4 |
0.010 |
|
|
|
|
|
| lipid, fatty acid and isoprenoid biosynthesis |
FunCat |
25 |
0.000 |
4 |
0.005 |
|
|
|
|
|
| Inositol phosphate metabolism |
KEGG |
25 |
0.000 |
6 |
0.009 |
|
|
|
|
|
| fatty acid metabolism |
TAIR-GO |
24 |
0.000 |
5 |
0.000 |
|
|
|
|
|
| long-chain fatty acid metabolism |
TAIR-GO |
24 |
0.000 |
5 |
0.000 |
|
|
|
|
|
| very-long-chain fatty acid metabolism |
TAIR-GO |
24 |
0.000 |
5 |
0.000 |
|
|
|
|
|
| glycerol degradation II |
AraCyc |
24 |
0.000 |
3 |
0.089 |
|
|
|
|
|
|
|
|
|
|
|
| ascorbic acid biosynthesis |
BioPath |
22 |
0.000 |
3 |
0.002 |
|
|
|
|
|
|
|
|
|
|
|
| cuticle biosynthesis |
TAIR-GO |
22 |
0.000 |
4 |
0.000 |
|
|
|
|
|
|
|
|
|
|
|
| GDP-D-rhamnose biosynthesis |
AraCyc |
22 |
0.000 |
3 |
0.001 |
|
|
|
|
|
|
|
|
|
|
|
| lactose degradation IV |
AraCyc |
22 |
0.000 |
5 |
0.000 |
|
|
|
|
|
|
|
|
|
|
|
| serine-isocitrate lyase pathway |
AraCyc |
22 |
0.000 |
4 |
0.026 |
|
|
|
|
|
|
|
|
|
|
|
| biogenesis of cell wall |
FunCat |
22 |
0.000 |
3 |
0.050 |
|
|
|
|
|
|
|
|
|
|
|
| indoleacetic acid biosynthesis |
TAIR-GO |
20 |
0.000 |
2 |
0.001 |
|
|
|
|
|
|
|
|
|
|
|
| glucosinolate biosynthesis from phenylalanine |
AraCyc |
20 |
0.000 |
2 |
0.000 |
|
|
|
|
|
|
|
|
|
|
|
| C-compound and carbohydrate utilization |
FunCat |
20 |
0.000 |
3 |
0.000 |
|
|
|
|
|
|
|
|
|
|
|
| Cyanoamino acid metabolism |
KEGG |
20 |
0.000 |
3 |
0.003 |
|
|
|
|
|
|
|
|
|
|
|
| Nitrogen metabolism |
KEGG |
20 |
0.000 |
2 |
0.043 |
|
|
|
|
|
|
|
|
|
|
|
| ascorbate glutathione cycle |
AraCyc |
18 |
0.000 |
2 |
0.021 |
|
|
|
|
|
|
|
|
|
|
|
| formylTHF biosynthesis |
AraCyc |
18 |
0.000 |
3 |
0.004 |
|
|
|
|
|
|
|
|
|
|
|
| galactose degradation I |
AraCyc |
18 |
0.000 |
4 |
0.000 |
|
|
|
|
|
|
|
|
|
|
|
| glycerol metabolism |
AraCyc |
18 |
0.000 |
2 |
0.017 |
|
|
|
|
|
|
|
|
|
|
|
| Ascorbate and aldarate metabolism |
KEGG |
18 |
0.000 |
2 |
0.023 |
|
|
|
|
|
|
|
|
|
|
|
| Methionine metabolism |
KEGG |
18 |
0.000 |
3 |
0.001 |
|
|
|
|
|
|
|
|
|
|
|
| Chlorophyll biosynthesis and breakdown |
BioPath |
16 |
0.002 |
2 |
0.059 |
|
|
|
|
|
|
|
|
|
|
|
| chlorophyll biosynthesis |
TAIR-GO |
16 |
0.000 |
2 |
0.015 |
|
|
|
|
|
|
|
|
|
|
|
| atty acid elongation -- unsaturated |
AraCyc |
16 |
0.000 |
4 |
0.001 |
|
|
|
|
|
|
|
|
|
|
|
| fatty acid biosynthesis -- initial steps |
AraCyc |
16 |
0.001 |
4 |
0.006 |
|
|
|
|
|
|
|
|
|
|
|
| fatty acid elongation -- saturated |
AraCyc |
16 |
0.000 |
4 |
0.001 |
|
|
|
|
|
|
|
|
|
|
|
| fatty acid elongation -- unsaturated |
AraCyc |
16 |
0.000 |
4 |
0.000 |
|
|
|
|
|
|
|
|
|
|
|
| sulfate assimilation III |
AraCyc |
16 |
0.028 |
3 |
0.034 |
|
|
|
|
|
|
|
|
|
|
|
| Glutamate metabolism |
KEGG |
16 |
0.002 |
2 |
0.088 |
|
|
|
|
|
|
|
|
|
|
|
| transport |
FunCat |
15 |
0.000 |
3 |
0.000 |
|
|
|
|
|
|
|
|
|
|
|
| Fructose and mannose metabolism |
KEGG |
14.5 |
0.006 |
3 |
0.026 |
|
|
|
|
|
|
|
|
|
|
|
| Methionin/SAM/ethylene metabolism from cysteine and aspartate |
BioPath |
14 |
0.000 |
2 |
0.046 |
|
|
|
|
|
|
|
|
|
|
|
| wax biosynthesis |
TAIR-GO |
14 |
0.000 |
2 |
0.002 |
|
|
|
|
|
|
|
|
|
|
|
| formaldehyde assimilation I (serine pathway) |
AraCyc |
14 |
0.004 |
3 |
0.034 |
|
|
|
|
|
|
|
|
|
|
|
| methionine biosynthesis II |
AraCyc |
14 |
0.000 |
2 |
0.011 |
|
|
|
|
|
|
|
|
|
|
|
| Phenylalanine metabolism |
KEGG |
14 |
0.017 |
3 |
0.166 |
|
|
|
|
|
|
|
|
|
|
|
| Selenoamino acid metabolism |
KEGG |
14 |
0.001 |
2 |
0.036 |
|
|
|
|
|
|
|
|
|
|
|
| Flavonoid and anthocyanin metabolism |
BioPath |
13 |
0.002 |
3 |
0.060 |
|
|
|
|
|
|
|
|
|
|
|
| transport ATPases |
FunCat |
13 |
0.000 |
2 |
0.031 |
|
|
|
|
|
|
|
|
|
|
|
| transport facilitation |
FunCat |
13 |
0.000 |
2 |
0.000 |
|
|
|
|
|
|
|
|
|
|
|
|
|
|
|
|
|
|
|
|
|
|
|
|
|
|
|
|
|
|
|
|
|
|
|
|
|
|
|
|
|
|
|
|
|
|
|
|
|
|
|
|
|
|
|
|
|
|
|
|
|
|
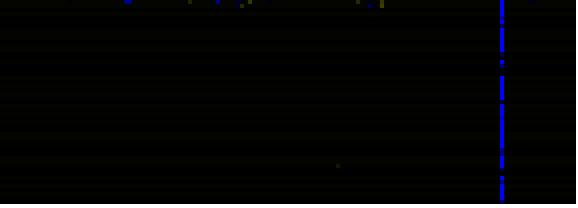
| Pathways co-expressed in the Mutant data set (with more than 10 annotation points) |
|
CYP71B2 (At1g13080) |
|
|
|
|
|
|
|
|
| max. difference between log2-ratios: |
5.1 |
|
|
|
|
|
|
|
|
|
|
|
|
| max. difference between log2-ratios excluding lowest and highest 5%: |
0.2 |
|
|
|
|
|
|
|
|
|
|
|
|
| Pathway |
Source |
Scores of Genes |
p[Score] |
No. of Genes |
p[genes] |
Link to mutants heatmap |
|
|
|
|
|
|
|
| Cell Wall Carbohydrate Metabolism |
BioPath |
203.5 |
0.000 |
64 |
0.000 |
|
|
|
|
| C-compound and carbohydrate metabolism |
FunCat |
119 |
0.000 |
30 |
0.036 |
|
|
|
| Ribosome |
KEGG |
101 |
0.029 |
21 |
0.316 |
|
|
|
| Phenylpropanoid Metabolism |
BioPath |
94 |
0.016 |
18 |
0.474 |
|
|
|
| pectin metabolism |
BioPath |
92.5 |
0.000 |
42 |
0.000 |
|
|
|
| mono-/sesqui-/di-terpene biosynthesis |
LitPath |
62 |
0.000 |
11 |
0.001 |
|
|
|
| terpenoid metabolism |
LitPath |
62 |
0.000 |
11 |
0.001 |
|
|
|
| Lipid signaling |
AcylLipid |
61 |
0.005 |
14 |
0.164 |
|
|
|
| Isoprenoid Biosynthesis in the Cytosol and in Mitochondria |
BioPath |
56 |
0.000 |
9 |
0.128 |
|
|
|
| Nucleotide Metabolism |
KEGG |
47 |
0.000 |
10 |
0.031 |
|
|
|
| Starch and sucrose metabolism |
KEGG |
45 |
0.000 |
11 |
0.012 |
|
|
|
| Pyruvate metabolism |
KEGG |
44 |
0.000 |
8 |
0.102 |
|
|
|
| Purine metabolism |
KEGG |
41 |
0.000 |
8 |
0.040 |
|
|
|
| Biosynthesis of prenyl diphosphates |
BioPath |
40 |
0.001 |
7 |
0.090 |
|
|
|
|
|
|
|
|
|
|
|
| transport |
FunCat |
40 |
0.000 |
11 |
0.000 |
|
|
|
|
|
|
|
|
|
|
|
| biogenesis of cell wall |
FunCat |
38 |
0.000 |
13 |
0.001 |
|
|
|
|
|
|
|
|
|
|
|
| lipases pathway |
AraCyc |
37 |
0.000 |
6 |
0.004 |
|
|
|
|
|
|
|
|
|
|
|
| cellulose biosynthesis |
BioPath |
36 |
0.000 |
8 |
0.044 |
|
|
|
|
|
|
|
|
|
|
|
| Flavonoid and anthocyanin metabolism |
BioPath |
36 |
0.000 |
8 |
0.125 |
|
|
|
|
|
|
|
|
|
|
|
| transport facilitation |
FunCat |
36 |
0.000 |
10 |
0.000 |
|
|
|
|
|
|
|
|
|
|
|
| acetate fermentation |
AraCyc |
34 |
0.001 |
9 |
0.052 |
|
|
|
|
|
|
|
|
|
|
|
| nucleotide metabolism |
FunCat |
34 |
0.000 |
7 |
0.000 |
|
|
|
|
|
|
|
|
|
|
|
| lipid, fatty acid and isoprenoid degradation |
FunCat |
33 |
0.000 |
4 |
0.074 |
|
|
|
|
|
|
|
|
|
|
|
| brassinosteroid biosynthesis |
LitPath |
33 |
0.001 |
4 |
0.179 |
|
|
|
|
|
|
|
|
|
|
|
| fructose degradation (anaerobic) |
AraCyc |
32 |
0.001 |
9 |
0.033 |
|
|
|
|
|
|
|
|
|
|
|
| glycolysis IV |
AraCyc |
32 |
0.001 |
9 |
0.037 |
|
|
|
|
|
|
|
|
|
|
|
| sorbitol fermentation |
AraCyc |
32 |
0.003 |
9 |
0.044 |
|
|
|
|
|
|
|
|
|
|
|
| Pyrimidine metabolism |
KEGG |
32 |
0.000 |
8 |
0.003 |
|
|
|
|
|
|
|
|
|
|
|
| Translation factors |
KEGG |
32 |
0.004 |
10 |
0.066 |
|
|
|
|
|
|
|
|
|
|
|
| Biosynthesis of steroids |
KEGG |
30 |
0.034 |
6 |
0.062 |
|
|
|
|
|
|
|
|
|
|
|
| Fatty acid elongation and wax and cutin metabolism |
AcylLipid |
30 |
0.023 |
6 |
0.288 |
|
|
|
|
|
|
|
|
|
|
|
| intracellular signalling |
FunCat |
28.5 |
0.000 |
7 |
0.092 |
|
|
|
|
|
|
|
|
|
|
|
| C-compound, carbohydrate catabolism |
FunCat |
28 |
0.000 |
7 |
0.020 |
|
|
|
|
|
|
|
|
|
|
|
| prenyl diphosphate (GPP,FPP, GGPP) biosynthesis |
LitPath |
28 |
0.000 |
4 |
0.054 |
|
|
|
|
|
|
|
|
|
|
|
| trans-zeatin biosynthesis |
AraCyc |
27 |
0.000 |
6 |
0.000 |
|
|
|
|
|
|
|
|
|
|
|
| proanthocyanidin biosynthesis |
TAIR-GO |
26 |
0.000 |
3 |
0.000 |
|
|
|
|
|
|
|
|
|
|
|
| cellulose biosynthesis |
AraCyc |
26 |
0.003 |
6 |
0.068 |
|
|
|
|
|
|
|
|
|
|
|
| lactose degradation IV |
AraCyc |
26 |
0.000 |
7 |
0.000 |
|
|
|
|
|
|
|
|
|
|
|
| Citrate cycle (TCA cycle) |
KEGG |
26 |
0.001 |
4 |
0.209 |
|
|
|
|
|
|
|
|
|
|
|
| Fructose and mannose metabolism |
KEGG |
26 |
0.006 |
4 |
0.283 |
|
|
|
|
|
|
|
|
|
|
|
| Nitrogen metabolism |
KEGG |
26 |
0.004 |
3 |
0.233 |
|
|
|
|
|
|
|
|
|
|
|
| Phenylalanine, tyrosine and tryptophan biosynthesis |
KEGG |
26 |
0.012 |
3 |
0.431 |
|
|
|
|
|
|
|
|
|
|
|
| dTDP-rhamnose biosynthesis |
AraCyc |
25 |
0.000 |
5 |
0.143 |
|
|
|
|
|
|
|
|
|
|
|
| UDP-N-acetylglucosamine biosynthesis |
AraCyc |
25 |
0.000 |
4 |
0.000 |
|
|
|
|
|
|
|
|
|
|
|
| Cyanoamino acid metabolism |
KEGG |
25 |
0.000 |
6 |
0.002 |
|
|
|
|
|
|
|
|
|
|
|
| aspartate/ornithin cycle / nitric oxid from glutamate |
BioPath |
24 |
0.000 |
4 |
0.012 |
|
|
|
|
|
|
|
|
|
|
|
| sterol biosynthesis |
BioPath |
24 |
0.020 |
3 |
0.299 |
|
|
|
|
|
|
|
|
|
|
|
| TCA cycle -- aerobic respiration |
AraCyc |
24 |
0.015 |
6 |
0.091 |
|
|
|
|
|
|
|
|
|
|
|
| TCA cycle variation IV |
AraCyc |
24 |
0.011 |
6 |
0.075 |
|
|
|
|
|
|
|
|
|
|
|
| TCA cycle variation VIII |
AraCyc |
24 |
0.037 |
6 |
0.108 |
|
|
|
|
|
|
|
|
|
|
|
|
|
|
|
|
|
|
|
|
|
|
|
|
|
|
|
|