| _________________________________________ |
|
|
|
|
|
|
|
|
|
|
|
|
|
|
|
|
| Pathways co-expressed in all 4 data sets (with more than 6 annotation points each) |
|
Find below a list of pathways that are co-expressed with the bait. First a list of pathways is given that are co-expressed in all data sets. Lists for each individual dataset are shown underneath. Depending on the number of co-expressed pathways only the top scoring pathways are given; all data can be saved as text using the link above. |

|
|
|
|
|
|
|
|
| Pathway |
Source |
Sum of scores |
Sum of genes |
|
|
|
|
|
|
|
|
| Glutathione metabolism |
BioPath |
260 |
40 |
|
|
|
|
|
|
|
|
| Glutathione metabolism |
KEGG |
236 |
37 |
|
|
|
|
|
|
|
|
| Biosynthesis of Amino Acids and Derivatives |
BioPath |
190 |
28 |
|
|
|
|
|
|
|
|
| toxin catabolism |
TAIR-GO |
118 |
19 |
|
To the right of each table a thumbnail of the actual co-expression heatmap is given. Klick on the link to see the heatmap containing all co-expressed genes. |
|
|
|
|
|
|
|
|
|
| Stilbene, coumarine and lignin biosynthesis |
KEGG |
63 |
12 |
|
|
|
|
|
|
|
|
|
|
| Miscellaneous acyl lipid metabolism |
AcylLipid |
62 |
11 |
|
|
|
|
|
|
|
|
|
|
| biosynthesis of phenylpropanoids |
FunCat |
40 |
4 |
|
For more information on how these pathway maps were generated please read the methods page |
|
|
|
|
|
|
|
|
|
| biosynthesis of secondary products derived from L-phenylalanine and L-tyrosine |
FunCat |
40 |
4 |
|
|
|
|
|
|
|
|
|
|
| Fluorene degradation |
KEGG |
31 |
4 |
|
|
|
|
|
|
|
|
|
|
|
|
|
| gamma-Hexachlorocyclohexane degradation |
KEGG |
31 |
4 |
|
|
|
|
|
|
|
|
|
|
|
|
|
|
|
|
|
|
|
|
|
|
|
|
|
|
|
|
|
|
|
|
|
|
|
|
|
|
|
|
|
|
|
|
|
|
|
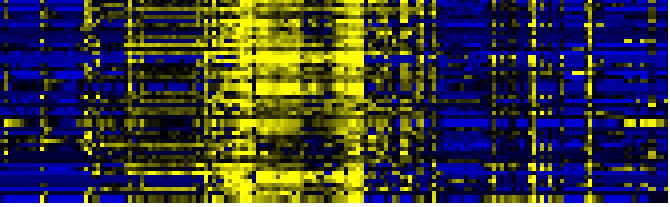
| Pathways co-expressed in the Organ and Tissue data set (with more than 8 annotation points) |
|
CYP71B23 (At3g26210) |
|
|
|
|
|
|
|
|
| max. difference between log2-ratios: |
6.8 |
|
|
|
|
|
|
|
|
|
|
|
|
| max. difference between log2-ratios excluding lowest and highest 5%: |
5.8 |
|
|
|
|
|
|
|
|
|
|
|
|
| Pathway |
Source |
Scores of Genes |
p[Score] |
No. of Genes |
p[genes] |
Link to organ heatmap |
|
|
|
|
|
|
|
| Biosynthesis of Amino Acids and Derivatives |
BioPath |
48 |
0.000 |
7 |
0.001 |
|
|
|
| Glutathione metabolism |
BioPath |
38 |
0.000 |
6 |
0.000 |
|
|
| Cell Wall Carbohydrate Metabolism |
BioPath |
28 |
0.012 |
4 |
0.404 |
|
|
| Sulfur metabolism |
KEGG |
24 |
0.000 |
3 |
0.000 |
|
|
| glucosinolate biosynthesis from tryptophan |
AraCyc |
20 |
0.000 |
2 |
0.000 |
|
|
| Glucosinolate Metabolism |
LitPath |
20 |
0.000 |
2 |
0.000 |
|
|
| stress response |
FunCat |
18 |
0.000 |
2 |
0.000 |
|
|
| toxin catabolism |
TAIR-GO |
14 |
0.000 |
3 |
0.005 |
|
|
| cysteine biosynthesis I |
AraCyc |
14 |
0.000 |
2 |
0.003 |
|
|
| nitrogen and sulfur metabolism |
FunCat |
14 |
0.000 |
2 |
0.000 |
|
|
| Cysteine metabolism |
KEGG |
14 |
0.000 |
2 |
0.003 |
|
|
| Glutathione metabolism |
KEGG |
14 |
0.000 |
3 |
0.001 |
|
|
| Selenoamino acid metabolism |
KEGG |
14 |
0.000 |
2 |
0.004 |
|
|
| Starch and sucrose metabolism |
KEGG |
14 |
0.000 |
2 |
0.052 |
|
|
|
|
|
|
|
|
|
|
|
| Lipid signaling |
AcylLipid |
14 |
0.000 |
3 |
0.069 |
|
|
|
|
|
|
|
|
|
|
|
| sucrose metabolism |
BioPath |
12 |
0.000 |
2 |
0.001 |
|
|
|
|
|
|
|
|
|
|
|
| glycolysis and gluconeogenesis |
FunCat |
12 |
0.005 |
2 |
0.059 |
|
|
|
|
|
|
|
|
|
|
|
| Miscellaneous acyl lipid metabolism |
AcylLipid |
12 |
0.002 |
3 |
0.088 |
|
|
|
|
|
|
|
|
|
|
|
| Chloroplastic protein turnover |
BioPath |
10 |
0.000 |
1 |
0.009 |
|
|
|
|
|
|
|
|
|
|
|
| ERD1 protease (ClpC-like) |
BioPath |
10 |
0.000 |
1 |
0.000 |
|
|
|
|
|
|
|
|
|
|
|
| Methionin/SAM/ethylene metabolism from cysteine and aspartate |
BioPath |
10 |
0.000 |
1 |
0.053 |
|
|
|
|
|
|
|
|
|
|
|
| ATP-dependent proteolysis |
TAIR-GO |
10 |
0.000 |
1 |
0.012 |
|
|
|
|
|
|
|
|
|
|
|
| cellular response to sulfate starvation |
TAIR-GO |
10 |
0.000 |
1 |
0.000 |
|
|
|
|
|
|
|
|
|
|
|
| glucosinolate biosynthesis |
TAIR-GO |
10 |
0.000 |
1 |
0.006 |
|
|
|
|
|
|
|
|
|
|
|
| indole glucosinolate biosynthesis |
TAIR-GO |
10 |
0.000 |
1 |
0.000 |
|
|
|
|
|
|
|
|
|
|
|
| indoleacetic acid biosynthesis |
TAIR-GO |
10 |
0.000 |
1 |
0.002 |
|
|
|
|
|
|
|
|
|
|
|
| response to red light |
TAIR-GO |
10 |
0.000 |
1 |
0.000 |
|
|
|
|
|
|
|
|
|
|
|
| shade avoidance |
TAIR-GO |
10 |
0.000 |
1 |
0.000 |
|
|
|
|
|
|
|
|
|
|
|
| tryptophan biosynthesis |
TAIR-GO |
10 |
0.000 |
1 |
0.028 |
|
|
|
|
|
|
|
|
|
|
|
| tryptophan catabolism |
TAIR-GO |
10 |
0.000 |
1 |
0.000 |
|
|
|
|
|
|
|
|
|
|
|
| glucosinolate biosynthesis from phenylalanine |
AraCyc |
10 |
0.000 |
1 |
0.000 |
|
|
|
|
|
|
|
|
|
|
|
| IAA biosynthesis |
AraCyc |
10 |
0.000 |
1 |
0.003 |
|
|
|
|
|
|
|
|
|
|
|
| IAA biosynthesis I |
AraCyc |
10 |
0.000 |
1 |
0.002 |
|
|
|
|
|
|
|
|
|
|
|
| sulfate assimilation III |
AraCyc |
10 |
0.000 |
1 |
0.023 |
|
|
|
|
|
|
|
|
|
|
|
| biosynthesis of phenylpropanoids |
FunCat |
10 |
0.000 |
1 |
0.027 |
|
|
|
|
|
|
|
|
|
|
|
| biosynthesis of secondary products derived from L-phenylalanine and L-tyrosine |
FunCat |
10 |
0.000 |
1 |
0.027 |
|
|
|
|
|
|
|
|
|
|
|
| nucleotide metabolism |
FunCat |
10 |
0.000 |
1 |
0.000 |
|
|
|
|
|
|
|
|
|
|
|
| Ascorbate and aldarate metabolism |
KEGG |
10 |
0.000 |
1 |
0.032 |
|
|
|
|
|
|
|
|
|
|
|
| Fluorene degradation |
KEGG |
10 |
0.000 |
1 |
0.012 |
|
|
|
|
|
|
|
|
|
|
|
| Galactose metabolism |
KEGG |
10 |
0.000 |
1 |
0.047 |
|
|
|
|
|
|
|
|
|
|
|
| gamma-Hexachlorocyclohexane degradation |
KEGG |
10 |
0.000 |
1 |
0.015 |
|
|
|
|
|
|
|
|
|
|
|
| Ion channels |
KEGG |
10 |
0.000 |
4 |
0.000 |
|
|
|
|
|
|
|
|
|
|
|
| Ligand-Receptor Interaction |
KEGG |
10 |
0.000 |
4 |
0.000 |
|
|
|
|
|
|
|
|
|
|
|
| Purine metabolism |
KEGG |
10 |
0.002 |
1 |
0.147 |
|
|
|
|
|
|
|
|
|
|
|
| Stilbene, coumarine and lignin biosynthesis |
KEGG |
10 |
0.005 |
1 |
0.309 |
|
|
|
|
|
|
|
|
|
|
|
|
|
|
|
|
|
|
|
|
|
|
|
|
|
|
|
|
|
|
|
|
|
|
|
|
|
|
|
|
|
|
|
|
|
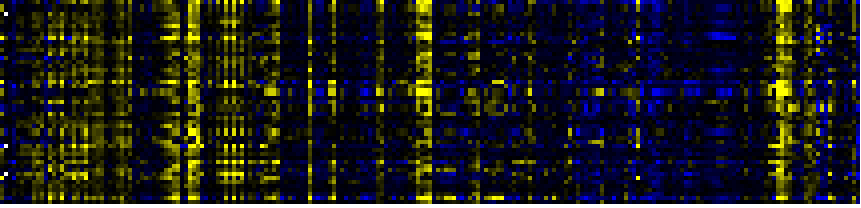
| Pathways co-expressed in the Stress data set ( with more than 10 annotation points) |
|
CYP71B23 (At3g26210) |
|
|
|
|
|
|
|
|
| max. difference between log2-ratios: |
8.0 |
|
|
|
|
|
|
|
|
|
|
|
|
| max. difference between log2-ratios excluding lowest and highest 5%: |
4.6 |
|
|
|
|
|
|
|
|
|
|
|
|
| Pathway |
Source |
Scores of Genes |
p[Score] |
No. of Genes |
p[genes] |
Link to stress heatmap |
|
|
|
|
|
|
|
| Biosynthesis of Amino Acids and Derivatives |
BioPath |
74 |
0.000 |
11 |
0.000 |
|
| Intermediary Carbon Metabolism |
BioPath |
62 |
0.000 |
13 |
0.000 |
| C-compound and carbohydrate metabolism |
FunCat |
57 |
0.000 |
11 |
0.005 |
| Glutathione metabolism |
KEGG |
56 |
0.000 |
9 |
0.000 |
| Glutathione metabolism |
BioPath |
50 |
0.000 |
7 |
0.000 |
| Phenylpropanoid Metabolism |
BioPath |
46 |
0.000 |
7 |
0.052 |
| toxin catabolism |
TAIR-GO |
46 |
0.000 |
7 |
0.000 |
| Citrate cycle (TCA cycle) |
KEGG |
46 |
0.000 |
9 |
0.000 |
| tricarboxylic-acid pathway (citrate cycle, Krebs cycle, TCA cycle) |
FunCat |
40 |
0.000 |
9 |
0.000 |
| Gluconeogenesis from lipids in seeds |
BioPath |
34 |
0.000 |
4 |
0.023 |
| Fatty acid metabolism |
KEGG |
32 |
0.000 |
4 |
0.007 |
| Stilbene, coumarine and lignin biosynthesis |
KEGG |
29 |
0.000 |
8 |
0.009 |
| Glycan Biosynthesis and Metabolism |
KEGG |
26 |
0.000 |
5 |
0.025 |
| Miscellaneous acyl lipid metabolism |
AcylLipid |
26 |
0.001 |
4 |
0.145 |
|
|
|
|
|
|
|
|
|
|
|
| TCA cycle -- aerobic respiration |
AraCyc |
24 |
0.000 |
5 |
0.000 |
|
|
|
|
|
|
|
|
|
|
|
| TCA cycle variation VII |
AraCyc |
24 |
0.000 |
5 |
0.004 |
|
|
|
|
|
|
|
|
|
|
|
| TCA cycle variation VIII |
AraCyc |
24 |
0.000 |
5 |
0.001 |
|
|
|
|
|
|
|
|
|
|
|
| amino acid metabolism |
FunCat |
24 |
0.003 |
3 |
0.153 |
|
|
|
|
|
|
|
|
|
|
|
| glycolysis and gluconeogenesis |
FunCat |
22 |
0.003 |
4 |
0.086 |
|
|
|
|
|
|
|
|
|
|
|
| Pyruvate metabolism |
KEGG |
22 |
0.007 |
4 |
0.115 |
|
|
|
|
|
|
|
|
|
|
|
| Degradation of storage lipids and straight fatty acids |
AcylLipid |
22 |
0.000 |
3 |
0.007 |
|
|
|
|
|
|
|
|
|
|
|
| Aromatic amino acid (Phe, Tyr, Trp) metabolism |
BioPath |
20 |
0.000 |
2 |
0.146 |
|
|
|
|
|
|
|
|
|
|
|
| tryptophan biosynthesis |
TAIR-GO |
20 |
0.000 |
2 |
0.002 |
|
|
|
|
|
|
|
|
|
|
|
| Shikimate pathway |
LitPath |
20 |
0.000 |
2 |
0.022 |
|
|
|
|
|
|
|
|
|
|
|
| Trp biosyntesis |
LitPath |
20 |
0.000 |
2 |
0.002 |
|
|
|
|
|
|
|
|
|
|
|
| leucine biosynthesis |
AraCyc |
18 |
0.000 |
4 |
0.000 |
|
|
|
|
|
|
|
|
|
|
|
| Aminosugars metabolism |
KEGG |
17 |
0.000 |
3 |
0.006 |
|
|
|
|
|
|
|
|
|
|
|
| acetyl-CoA assimilation |
AraCyc |
16 |
0.000 |
3 |
0.005 |
|
|
|
|
|
|
|
|
|
|
|
| glyoxylate cycle |
AraCyc |
16 |
0.000 |
3 |
0.001 |
|
|
|
|
|
|
|
|
|
|
|
| serine-isocitrate lyase pathway |
AraCyc |
16 |
0.000 |
3 |
0.016 |
|
|
|
|
|
|
|
|
|
|
|
| Glyoxylate and dicarboxylate metabolism |
KEGG |
16 |
0.000 |
3 |
0.017 |
|
|
|
|
|
|
|
|
|
|
|
| Phenylpropanoid pathway |
LitPath |
16 |
0.001 |
4 |
0.005 |
|
|
|
|
|
|
|
|
|
|
|
| detoxification |
FunCat |
15 |
0.000 |
6 |
0.000 |
|
|
|
|
|
|
|
|
|
|
|
| core phenylpropanoid metabolism |
BioPath |
14 |
0.009 |
3 |
0.022 |
|
|
|
|
|
|
|
|
|
|
|
| Prolin/Hydroxyproline from glutamate |
BioPath |
14 |
0.000 |
3 |
0.000 |
|
|
|
|
|
|
|
|
|
|
|
| TCA cycle variation IV |
AraCyc |
14 |
0.000 |
3 |
0.016 |
|
|
|
|
|
|
|
|
|
|
|
| lipid, fatty acid and isoprenoid degradation |
FunCat |
14 |
0.000 |
3 |
0.002 |
|
|
|
|
|
|
|
|
|
|
|
| Galactose metabolism |
KEGG |
14 |
0.001 |
2 |
0.098 |
|
|
|
|
|
|
|
|
|
|
|
| lignin biosynthesis |
AraCyc |
12 |
0.002 |
2 |
0.070 |
|
|
|
|
|
|
|
|
|
|
|
| disease, virulence and defense |
FunCat |
12 |
0.000 |
4 |
0.000 |
|
|
|
|
|
|
|
|
|
|
|
| Glycerolipid metabolism |
KEGG |
12 |
0.019 |
2 |
0.114 |
|
|
|
|
|
|
|
|
|
|
|
| beta-Alanine metabolism |
KEGG |
11 |
0.000 |
2 |
0.033 |
|
|
|
|
|
|
|
|
|
|
|
|
|
|
|
|
|
|
|
|
|
|
|
|
|
|
|
|
|
|
|
|
|
|
|
|
|
|
|
|
|
|
|
|
|
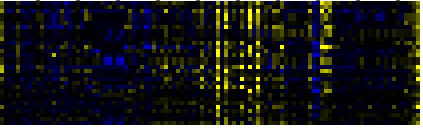
| Pathways co-expressed in the Hormone etc. data set (with more than 6 annotation points) |
|
CYP71B23 (At3g26210) |
|
|
|
|
|
|
|
|
| max. difference between log2-ratios: |
4.7 |
|
|
|
|
|
|
|
|
|
|
|
|
| max. difference between log2-ratios excluding lowest and highest 5%: |
2.7 |
|
|
|
|
|
|
|
|
|
|
|
|
| Pathway |
Source |
Scores of Genes |
p[Score] |
No. of Genes |
p[genes] |
Link to hormones etc. heatmap |
|
|
|
|
|
|
|
| Biosynthesis of Amino Acids and Derivatives |
BioPath |
44 |
0.000 |
6 |
0.000 |
|
|
|
|
|
|
| Glutathione metabolism |
BioPath |
34 |
0.000 |
5 |
0.000 |
|
|
|
|
|
| toxin catabolism |
TAIR-GO |
34 |
0.000 |
5 |
0.000 |
|
|
|
|
|
| Glutathione metabolism |
KEGG |
34 |
0.000 |
5 |
0.000 |
|
|
|
|
|
| Nitrogen metabolism |
KEGG |
19 |
0.000 |
2 |
0.003 |
|
|
|
|
|
| Stilbene, coumarine and lignin biosynthesis |
KEGG |
17 |
0.000 |
2 |
0.062 |
|
|
|
|
|
| Glycan Biosynthesis and Metabolism |
KEGG |
12 |
0.000 |
2 |
0.020 |
|
|
|
|
|
| Miscellaneous acyl lipid metabolism |
AcylLipid |
12 |
0.000 |
2 |
0.061 |
|
|
|
|
|
| Gluconeogenesis from lipids in seeds |
BioPath |
10 |
0.000 |
1 |
0.048 |
|
|
|
|
|
|
|
|
|
|
|
| Glutamate/glutamine from nitrogen fixation |
BioPath |
10 |
0.000 |
1 |
0.002 |
|
|
|
|
|
|
|
|
|
|
|
| fatty acid biosynthesis |
TAIR-GO |
10 |
0.000 |
1 |
0.004 |
|
|
|
|
|
|
|
|
|
|
|
| response to stress |
TAIR-GO |
10 |
0.000 |
1 |
0.000 |
|
|
|
|
|
|
|
|
|
|
|
| ammonia assimilation cycle |
AraCyc |
10 |
0.000 |
1 |
0.001 |
|
|
|
|
|
|
|
|
|
|
|
| fatty acid oxidation pathway |
AraCyc |
10 |
0.000 |
1 |
0.003 |
|
|
|
|
|
|
|
|
|
|
|
| glutamine biosynthesis I |
AraCyc |
10 |
0.000 |
1 |
0.000 |
|
|
|
|
|
|
|
|
|
|
|
| nitrate assimilation pathway |
AraCyc |
10 |
0.000 |
1 |
0.001 |
|
|
|
|
|
|
|
|
|
|
|
| octane oxidation |
AraCyc |
10 |
0.000 |
1 |
0.001 |
|
|
|
|
|
|
|
|
|
|
|
| amino acid metabolism |
FunCat |
10 |
0.008 |
1 |
0.107 |
|
|
|
|
|
|
|
|
|
|
|
| assimilation of ammonia, metabolism of the glutamate group |
FunCat |
10 |
0.000 |
1 |
0.006 |
|
|
|
|
|
|
|
|
|
|
|
| biosynthesis of phenylpropanoids |
FunCat |
10 |
0.000 |
1 |
0.014 |
|
|
|
|
|
|
|
|
|
|
|
| biosynthesis of secondary products derived from L-phenylalanine and L-tyrosine |
FunCat |
10 |
0.000 |
1 |
0.014 |
|
|
|
|
|
|
|
|
|
|
|
| defense related proteins |
FunCat |
10 |
0.000 |
2 |
0.000 |
|
|
|
|
|
|
|
|
|
|
|
| degradation |
FunCat |
10 |
0.000 |
1 |
0.008 |
|
|
|
|
|
|
|
|
|
|
|
| degradation of lipids, fatty acids and isoprenoids |
FunCat |
10 |
0.000 |
1 |
0.000 |
|
|
|
|
|
|
|
|
|
|
|
| disease, virulence and defense |
FunCat |
10 |
0.000 |
2 |
0.000 |
|
|
|
|
|
|
|
|
|
|
|
| nitrogen and sulfur metabolism |
FunCat |
10 |
0.000 |
1 |
0.005 |
|
|
|
|
|
|
|
|
|
|
|
| Fatty acid metabolism |
KEGG |
10 |
0.000 |
1 |
0.039 |
|
|
|
|
|
|
|
|
|
|
|
| Glutamate metabolism |
KEGG |
10 |
0.000 |
1 |
0.059 |
|
|
|
|
|
|
|
|
|
|
|
| Peptidoglycan biosynthesis |
KEGG |
10 |
0.000 |
1 |
0.001 |
|
|
|
|
|
|
|
|
|
|
|
| Tryptophan metabolism |
KEGG |
10 |
0.000 |
2 |
0.004 |
|
|
|
|
|
|
|
|
|
|
|
| ethylene biosynthesis |
TAIR-GO |
9 |
0.000 |
1 |
0.001 |
|
|
|
|
|
|
|
|
|
|
|
| acrylonitrile degradation |
AraCyc |
9 |
0.000 |
1 |
0.000 |
|
|
|
|
|
|
|
|
|
|
|
| aldoxime degradation |
AraCyc |
9 |
0.000 |
1 |
0.000 |
|
|
|
|
|
|
|
|
|
|
|
| IAA biosynthesis |
AraCyc |
9 |
0.000 |
1 |
0.001 |
|
|
|
|
|
|
|
|
|
|
|
| IAA biosynthesis I |
AraCyc |
9 |
0.000 |
1 |
0.001 |
|
|
|
|
|
|
|
|
|
|
|
| nitrogen and sulfur utilization |
FunCat |
9 |
0.000 |
1 |
0.001 |
|
|
|
|
|
|
|
|
|
|
|
| Benzoate degradation via CoA ligation |
KEGG |
9 |
0.004 |
1 |
0.198 |
|
|
|
|
|
|
|
|
|
|
|
| Cyanoamino acid metabolism |
KEGG |
9 |
0.000 |
1 |
0.022 |
|
|
|
|
|
|
|
|
|
|
|
| indole phytoalexin biosynthesis |
TAIR-GO |
7 |
0.000 |
1 |
0.000 |
|
|
|
|
|
|
|
|
|
|
|
| camalexin biosynthesis |
AraCyc |
7 |
0.000 |
1 |
0.000 |
|
|
|
|
|
|
|
|
|
|
|
| Ascorbate and aldarate metabolism |
KEGG |
7 |
0.000 |
1 |
0.022 |
|
|
|
|
|
|
|
|
|
|
|
| Fluorene degradation |
KEGG |
7 |
0.000 |
1 |
0.008 |
|
|
|
|
|
|
|
|
|
|
|
| gamma-Hexachlorocyclohexane degradation |
KEGG |
7 |
0.000 |
1 |
0.010 |
|
|
|
|
|
|
|
|
|
|
|
| camalexin biosynthesis |
LitPath |
7 |
0.000 |
1 |
0.000 |
|
|
|
|
|
|
|
|
|
|
|
|
|
|
|
|
|
|
|
|
|
|
|
|
|
|
|
|
|
|
|
|
|
|
|
|
|
|
|
|
|
|
|
|
|
|
|
|
|
|
|
|
|
|
|
|
|
|
|
|
|
|
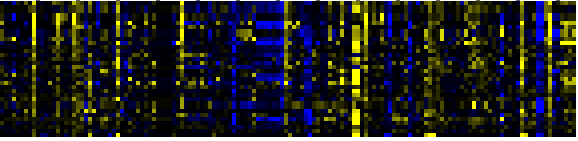
| Pathways co-expressed in the Mutant data set (with more than 6 annotation points) |
|
CYP71B23 (At3g26210) |
|
|
|
|
|
|
|
|
| max. difference between log2-ratios: |
6.3 |
|
|
|
|
|
|
|
|
|
|
|
|
| max. difference between log2-ratios excluding lowest and highest 5%: |
3.7 |
|
|
|
|
|
|
|
|
|
|
|
|
| Pathway |
Source |
Scores of Genes |
p[Score] |
No. of Genes |
p[genes] |
Link to mutants heatmap |
|
|
|
|
|
|
|
| Biosynthesis of Amino Acids and Derivatives |
BioPath |
24 |
0.000 |
4 |
0.004 |
|
|
|
|
| Glutathione metabolism |
BioPath |
24 |
0.000 |
4 |
0.000 |
|
|
|
| toxin catabolism |
TAIR-GO |
24 |
0.000 |
4 |
0.000 |
|
|
|
| Glutathione metabolism |
KEGG |
24 |
0.000 |
4 |
0.000 |
|
|
|
| triacylglycerol degradation |
AraCyc |
21.5 |
0.000 |
4 |
0.000 |
|
|
|
| systemic acquired resistance |
TAIR-GO |
13.5 |
0.000 |
3 |
0.000 |
|
|
|
| jasmonic acid biosynthesis |
TAIR-GO |
12 |
0.000 |
2 |
0.002 |
|
|
|
| jasmonic acid biosynthesis |
AraCyc |
12 |
0.000 |
2 |
0.000 |
|
|
|
| Miscellaneous acyl lipid metabolism |
AcylLipid |
12 |
0.000 |
2 |
0.124 |
|
|
|
| disease, virulence and defense |
FunCat |
11 |
0.000 |
2 |
0.000 |
|
|
|
|
|
|
|
|
|
|
|
| Phosphatidylinositol signaling system |
KEGG |
11 |
0.000 |
2 |
0.002 |
|
|
|
|
|
|
|
|
|
|
|
| Signal Transduction |
KEGG |
11 |
0.000 |
2 |
0.002 |
|
|
|
|
|
|
|
|
|
|
|
| aging |
TAIR-GO |
10 |
0.000 |
1 |
0.005 |
|
|
|
|
|
|
|
|
|
|
|
| response to stress |
TAIR-GO |
10 |
0.000 |
1 |
0.001 |
|
|
|
|
|
|
|
|
|
|
|
| biosynthesis of phenylpropanoids |
FunCat |
10 |
0.000 |
1 |
0.005 |
|
|
|
|
|
|
|
|
|
|
|
| biosynthesis of secondary products derived from L-phenylalanine and L-tyrosine |
FunCat |
10 |
0.000 |
1 |
0.005 |
|
|
|
|
|
|
|
|
|
|
|
| Lipid signaling |
AcylLipid |
10 |
0.012 |
2 |
0.102 |
|
|
|
|
|
|
|
|
|
|
|
| systemic acquired resistance, salicylic acid mediated signaling pathway |
TAIR-GO |
9.5 |
0.000 |
2 |
0.000 |
|
|
|
|
|
|
|
|
|
|
|
| calcium ion binding |
TAIR-GO |
9 |
0.000 |
1 |
0.002 |
|
|
|
|
|
|
|
|
|
|
|
| response to absence of light |
TAIR-GO |
9 |
0.000 |
1 |
0.000 |
|
|
|
|
|
|
|
|
|
|
|
| response to mechanical stimulus |
TAIR-GO |
9 |
0.000 |
1 |
0.001 |
|
|
|
|
|
|
|
|
|
|
|
| response to temperature |
TAIR-GO |
9 |
0.000 |
1 |
0.001 |
|
|
|
|
|
|
|
|
|
|
|
| thigmotropism |
TAIR-GO |
9 |
0.000 |
1 |
0.000 |
|
|
|
|
|
|
|
|
|
|
|
| indole phytoalexin biosynthesis |
TAIR-GO |
7 |
0.000 |
1 |
0.000 |
|
|
|
|
|
|
|
|
|
|
|
| camalexin biosynthesis |
AraCyc |
7 |
0.000 |
1 |
0.000 |
|
|
|
|
|
|
|
|
|
|
|
| resistance proteins |
FunCat |
7 |
0.000 |
1 |
0.000 |
|
|
|
|
|
|
|
|
|
|
|
| Ascorbate and aldarate metabolism |
KEGG |
7 |
0.000 |
1 |
0.014 |
|
|
|
|
|
|
|
|
|
|
|
| Fluorene degradation |
KEGG |
7 |
0.000 |
1 |
0.005 |
|
|
|
|
|
|
|
|
|
|
|
| gamma-Hexachlorocyclohexane degradation |
KEGG |
7 |
0.000 |
1 |
0.007 |
|
|
|
|
|
|
|
|
|
|
|
| Stilbene, coumarine and lignin biosynthesis |
KEGG |
7 |
0.004 |
1 |
0.167 |
|
|
|
|
|
|
|
|
|
|
|
| camalexin biosynthesis |
LitPath |
7 |
0.000 |
1 |
0.000 |
|
|
|
|
|
|
|
|
|
|
|
|
|
|
|
|
|
|
|
|
|
|
|
|
|
|
|
|