|
|
|
|
|
|
|
|
|
|
|
|
|
|
|
|
|
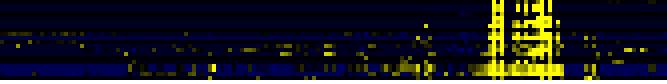
| Pathways co-expressed in the Organ and Tissue data set (with more than 6 annotation points) |
|
CYP71B38 / CYP71B5 (At3g44250 / At3g53280 ) |
|
|
|
|
|
|
|
|
| max. difference between log2-ratios: |
5.6 |
|
|
|
|
|
|
|
|
|
|
|
|
| max. difference between log2-ratios excluding lowest and highest 5%: |
0.4 |
|
|
|
|
|
|
|
|
|
|
|
|
| Pathway |
Source |
Scores of Genes |
p[Score] |
No. of Genes |
p[genes] |
Link to organ heatmap |
|
|
|
|
|
|
|
| mono-/sesqui-/di-terpene biosynthesis |
LitPath |
30 |
0.000 |
3 |
0.001 |
|
|
|
| terpenoid metabolism |
LitPath |
30 |
0.000 |
3 |
0.002 |
|
|
| Phenylpropanoid Metabolism |
BioPath |
20 |
0.000 |
4 |
0.001 |
|
|
| monoterpene biosynthesis |
LitPath |
20 |
0.000 |
2 |
0.000 |
|
|
| core phenylpropanoid metabolism |
BioPath |
14 |
0.000 |
3 |
0.000 |
|
|
| monoterpenoid biosynthesis |
TAIR-GO |
10 |
0.000 |
1 |
0.000 |
|
|
| monoterpene biosynthesis |
AraCyc |
10 |
0.000 |
1 |
0.000 |
|
|
|
|
|
|
|
|
|
|
|
| plant monoterpene biosynthesis |
AraCyc |
10 |
0.000 |
1 |
0.000 |
|
|
|
|
|
|
|
|
|
|
|
|
|
|
|
|
|
|
|
|
|
|
|
|
|
|
|
|
|
|
|
|
|
|
|
|
|
|
|
|
|
|
|
|
|
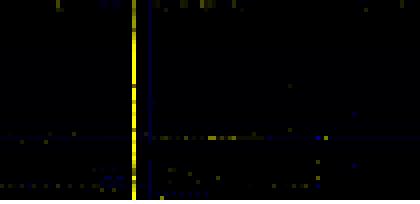
| Pathways co-expressed in the Stress data set ( with more than 6 annotation points) |
|
CYP71B38 / CYP71B5 (At3g44250 / At3g53280 ) |
|
|
|
|
|
|
|
|
| max. difference between log2-ratios: |
1.2 |
|
|
|
|
|
|
|
|
|
|
|
|
| max. difference between log2-ratios excluding lowest and highest 5%: |
0.2 |
|
|
|
|
|
|
|
|
|
|
|
|
| Pathway |
Source |
Scores of Genes |
p[Score] |
No. of Genes |
p[genes] |
Link to stress heatmap |
|
|
|
|
|
|
|
| nucleotide metabolism |
FunCat |
16 |
0.000 |
4 |
0.000 |

|
| (deoxy)ribose phosphate degradation |
AraCyc |
14 |
0.000 |
3 |
0.000 |
| pyrimidine nucleotide metabolism |
FunCat |
14 |
0.000 |
3 |
0.000 |
| Nucleotide Metabolism |
KEGG |
14 |
0.000 |
3 |
0.001 |
| Pyrimidine metabolism |
KEGG |
14 |
0.000 |
3 |
0.000 |
| secondary metabolism |
FunCat |
11 |
0.000 |
2 |
0.013 |
| Cell Wall Carbohydrate Metabolism |
BioPath |
10 |
0.000 |
4 |
0.023 |
| gibberellic acid biosynthesis |
TAIR-GO |
10 |
0.000 |
1 |
0.000 |
|
|
|
|
|
|
|
|
|
|
|
| gibberellin biosynthesis |
AraCyc |
10 |
0.000 |
1 |
0.000 |
|
|
|
|
|
|
|
|
|
|
|
| plant / fungal specific systemic sensing and response |
FunCat |
10 |
0.000 |
1 |
0.010 |
|
|
|
|
|
|
|
|
|
|
|
| plant hormonal regulation |
FunCat |
10 |
0.000 |
1 |
0.010 |
|
|
|
|
|
|
|
|
|
|
|
| Diterpenoid biosynthesis |
KEGG |
10 |
0.000 |
1 |
0.003 |
|
|
|
|
|
|
|
|
|
|
|
| Gibberellin metabolism |
LitPath |
10 |
0.000 |
1 |
0.028 |
|
|
|
|
|
|
|
|
|
|
|
| giberelin biosynthesis |
LitPath |
10 |
0.000 |
1 |
0.017 |
|
|
|
|
|
|
|
|
|
|
|
| Intermediary Carbon Metabolism |
BioPath |
8 |
0.000 |
2 |
0.046 |
|
|
|
|
|
|
|
|
|
|
|
| iron-sulfur cluster assembly |
TAIR-GO |
7 |
0.000 |
1 |
0.000 |
|
|
|
|
|
|
|
|
|
|
|
| Nitrogen metabolism |
KEGG |
7 |
0.000 |
1 |
0.017 |
|
|
|
|
|
|
|
|
|
|
|
| Carotenoid and abscisic acid metabolism |
LitPath |
7 |
0.000 |
2 |
0.004 |
|
|
|
|
|
|
|
|
|
|
|
|
|
|
|
|
|
|
|
|
|
|
|
|
|
|
|
|
|
|
|
|
|
|
|
|
|
|
|
|
|
|
|
|
|
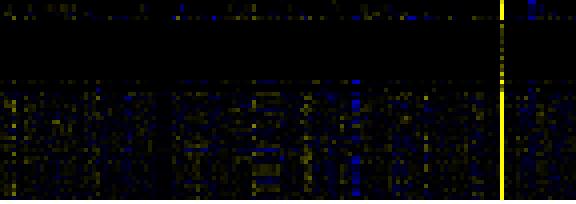
| Pathways co-expressed in the Hormone etc. data set (with more than 10 annotation points) |
|
CYP71B38 / CYP71B5 (At3g44250 / At3g53280 ) |
|
|
|
|
|
|
|
|
| max. difference between log2-ratios: |
1.9 |
|
|
|
|
|
|
|
|
|
|
|
|
| max. difference between log2-ratios excluding lowest and highest 5%: |
0.5 |
|
|
|
|
|
|
|
|
|
|
|
|
| Pathway |
Source |
Scores of Genes |
p[Score] |
No. of Genes |
p[genes] |
Link to hormones etc. heatmap |
|
|
|
|
|
|
|
| mono-/sesqui-/di-terpene biosynthesis |
LitPath |
54 |
0.000 |
6 |
0.000 |
|
|
|
|
|
|
| terpenoid metabolism |
LitPath |
54 |
0.000 |
6 |
0.000 |
|
|
|
|
|
| Miscellaneous acyl lipid metabolism |
AcylLipid |
44 |
0.000 |
16 |
0.000 |
|
|
|
|
|
| Starch and sucrose metabolism |
KEGG |
42 |
0.000 |
6 |
0.000 |
|
|
|
|
|
| sexual reproduction |
TAIR-GO |
20 |
0.000 |
5 |
0.000 |
|
|
|
|
|
| monoterpene biosynthesis |
LitPath |
20 |
0.000 |
2 |
0.000 |
|
|
|
|
|
| sucrose metabolism |
BioPath |
16 |
0.000 |
2 |
0.004 |
|
|
|
|
|
| Galactose metabolism |
KEGG |
16 |
0.000 |
2 |
0.003 |
|
|
|
|
|
| biogenesis of cell wall |
FunCat |
14 |
0.000 |
6 |
0.000 |
|
|
|
|
|
| C-compound and carbohydrate utilization |
FunCat |
14 |
0.000 |
2 |
0.000 |
|
|
|
|
|
| jasmonic acid biosynthesis |
TAIR-GO |
10 |
0.000 |
1 |
0.017 |
|
|
|
|
|
| jasmonic acid mediated signaling pathway |
TAIR-GO |
10 |
0.000 |
1 |
0.000 |
|
|
|
|
|
| jasmonic acid metabolism |
TAIR-GO |
10 |
0.000 |
1 |
0.000 |
|
|
|
|
|
| monoterpenoid biosynthesis |
TAIR-GO |
10 |
0.000 |
1 |
0.001 |
|
|
|
|
|
|
|
|
|
|
|
| N-terminal protein myristoylation |
TAIR-GO |
10 |
0.000 |
1 |
0.006 |
|
|
|
|
|
|
|
|
|
|
|
| pentacyclic triterpenoid biosynthesis |
TAIR-GO |
10 |
0.000 |
1 |
0.003 |
|
|
|
|
|
|
|
|
|
|
|
| response to wounding |
TAIR-GO |
10 |
0.000 |
1 |
0.022 |
|
|
|
|
|
|
|
|
|
|
|
| jasmonic acid biosynthesis |
AraCyc |
10 |
0.000 |
1 |
0.001 |
|
|
|
|
|
|
|
|
|
|
|
| monoterpene biosynthesis |
AraCyc |
10 |
0.000 |
1 |
0.000 |
|
|
|
|
|
|
|
|
|
|
|
| plant monoterpene biosynthesis |
AraCyc |
10 |
0.000 |
1 |
0.000 |
|
|
|
|
|
|
|
|
|
|
|
| C-compound, carbohydrate catabolism |
FunCat |
10 |
0.000 |
3 |
0.002 |
|
|
|
|
|
|
|
|
|
|
|
| Biosynthesis of steroids |
KEGG |
10 |
0.000 |
1 |
0.067 |
|
|
|
|
|
|
|
|
|
|
|
| sequiterpene biosynthesis |
LitPath |
10 |
0.000 |
1 |
0.001 |
|
|
|
|
|
|
|
|
|
|
|
| triterpene biosynthesis |
LitPath |
10 |
0.000 |
1 |
0.032 |
|
|
|
|
|
|
|
|
|
|
|
| cellulose biosynthesis |
AraCyc |
8 |
0.000 |
2 |
0.000 |
|
|
|
|
|
|
|
|
|
|
|
| lactose degradation IV |
AraCyc |
8 |
0.000 |
2 |
0.000 |
|
|
|
|
|
|
|
|
|
|
|
| Oxidative phosphorylation |
KEGG |
8 |
0.000 |
2 |
0.029 |
|
|
|
|
|
|
|
|
|
|
|
| Pentose and glucuronate interconversions |
KEGG |
8 |
0.000 |
2 |
0.000 |
|
|
|
|
|
|
|
|
|
|
|
|
|
|
|
|
|
|
|
|
|
|
|
|
|
|
|
|
|
|
|
|
|
|
|
|
|
|
|
|
|
|
|
|
|
|
|
|
|
|
|
|
|
|
|
|
|
|
|
|
|
|
| Pathways co-expressed in the Mutant data set (with more than 30 annotation points) |
|
CYP71B38 / CYP71B5 (At3g44250 / At3g53280 ) |
|
|
|
|
|
|
|
|
| max. difference between log2-ratios: |
4.4 |
|
|
|
|
|
|
|
|
|
|
|
|
| max. difference between log2-ratios excluding lowest and highest 5%: |
0.0 |
|
|
|
|
|
|
|
|
|
|
|
|
| Pathway |
Source |
Scores of Genes |
p[Score] |
No. of Genes |
p[genes] |
Link to mutants heatmap |
|
|
|
|
|
|
|
| Plastidial Isoprenoids (Chlorophylls, Carotenoids, Tocopherols, Plastoquinone, Phylloquinone) |
BioPath |
69 |
0.000 |
9 |
0.028 |
|
|
|
|
| protein synthesis |
FunCat |
66 |
0.001 |
15 |
0.010 |
|
|
|
| Folding, Sorting and Degradation |
KEGG |
60 |
0.000 |
9 |
0.155 |
|
|
|
| Oxidative phosphorylation |
KEGG |
50 |
0.000 |
12 |
0.001 |
|
|
|
| Gluconeogenesis from lipids in seeds |
BioPath |
49 |
0.000 |
9 |
0.007 |
|
|
|
| Carbon fixation |
KEGG |
46 |
0.000 |
9 |
0.008 |
|
|
|
| Citrate cycle (TCA cycle) |
KEGG |
46 |
0.000 |
7 |
0.004 |
|
|
|
| transport facilitation |
FunCat |
44 |
0.000 |
8 |
0.000 |
|
|
|
| Glycolysis / Gluconeogenesis |
KEGG |
43 |
0.008 |
8 |
0.060 |
|
|
|
| Pyruvate metabolism |
KEGG |
43 |
0.008 |
6 |
0.185 |
|
|
|
| Protein folding / chaperonins (chloroplast) |
BioPath |
40 |
0.000 |
5 |
0.000 |
|
|
|
| leucine biosynthesis |
AraCyc |
40 |
0.000 |
7 |
0.000 |
|
|
|
| development |
TAIR-GO |
39 |
0.000 |
5 |
0.058 |
|
|
|
|
|
|
|
|
|
|
|
| Isoprenoid Biosynthesis in the Cytosol and in Mitochondria |
BioPath |
38 |
0.040 |
5 |
0.184 |
|
|
|
|
|
|
|
|
|
|
|
| biogenesis of chloroplast |
FunCat |
38 |
0.023 |
5 |
0.236 |
|
|
|
|
|
|
|
|
|
|
|
| Translation factors |
KEGG |
38 |
0.002 |
9 |
0.050 |
|
|
|
|
|
|
|
|
|
|
|
| sterol biosynthesis |
BioPath |
36 |
0.000 |
4 |
0.018 |
|
|
|
|
|
|
|
|
|
|
|
| TCA cycle -- aerobic respiration |
AraCyc |
36 |
0.000 |
6 |
0.020 |
|
|
|
|
|
|
|
|
|
|
|
| TCA cycle variation VII |
AraCyc |
36 |
0.001 |
6 |
0.121 |
|
|
|
|
|
|
|
|
|
|
|
| TCA cycle variation VIII |
AraCyc |
36 |
0.000 |
6 |
0.025 |
|
|
|
|
|
|
|
|
|
|
|
| Glutamate metabolism |
KEGG |
36 |
0.001 |
5 |
0.057 |
|
|
|
|
|
|
|
|
|
|
|
| Proteasome |
KEGG |
33 |
0.001 |
5 |
0.119 |
|
|
|
|
|
|
|
|
|
|
|
| triterpene, sterol, and brassinosteroid metabolism |
LitPath |
33 |
0.033 |
5 |
0.242 |
|
|
|
|
|
|
|
|
|
|
|
| serine-isocitrate lyase pathway |
AraCyc |
32 |
0.000 |
5 |
0.049 |
|
|
|
|
|
|
|
|
|
|
|
| Reductive carboxylate cycle (CO2 fixation) |
KEGG |
32 |
0.000 |
5 |
0.001 |
|
|
|
|
|
|
|
|
|
|
|
|
|
|
|
|
|
|
|
|
|
|
|
|
|
|
|
|