| _________________________________________ |
|
|
|
|
|
|
|
|

|
|
|
|
|
| Pathways co-expressed in all 4 data sets (with more than 6 annotation points each) |
|
Find below a list of pathways that are co-expressed with the bait. First a list of pathways is given that are co-expressed in all data sets. Lists for each individual dataset are shown underneath. Depending on the number of co-expressed pathways only the top scoring pathways are given; all data can be saved as text using the link above. |
|
|
|
|
| Pathway |
Source |
Sum of scores |
Sum of genes |
|
|
|
|
|
| mono-/sesqui-/di-terpene biosynthesis |
LitPath |
98 |
11 |
|
|
|
|
|
| terpenoid metabolism |
LitPath |
98 |
11 |
|
|
|
|
|
|
|
| monoterpene biosynthesis |
LitPath |
70 |
7 |
|
|
|
|
|
|
|
| Phenylpropanoid Metabolism |
BioPath |
55 |
10 |
|
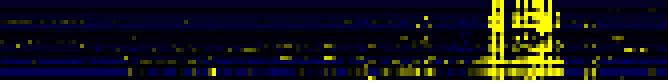
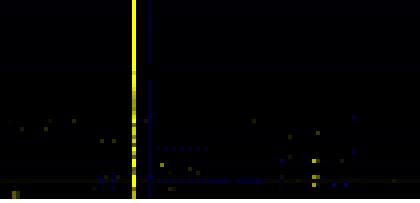
To the right of each table a thumbnail of the actual co-expression heatmap is given. Klick on the link to see the heatmap containing all co-expressed genes. |
|
|
|
|
|
|
| monoterpenoid biosynthesis |
TAIR-GO |
30 |
3 |
|
|
|
|
|
|
|
| plant monoterpene biosynthesis |
AraCyc |
30 |
3 |
|
|
|
|
|
|
|
|
|
|
|
|
For more information on how these pathway maps were generated please read the methods page |
|
|
|
|
|
|
|
|
|
|
|
|
|
|
|
|
|
|
|
|
|
|
|
|
|
|
|
|
|
|
|
|
|
|
|
|
|
|
|
|
|
|
|
|
|
|
|
| Pathways co-expressed in the Organ and Tissue data set (with more than 6 annotation points) |
|
CYP71B8 / CYP71B31 (At5g35715 / At3g53300) |
|
|
|
|
|
|
| max. difference between log2-ratios: |
10.6 |
|
|
|
|
|
|
|
|
|
|
| max. difference between log2-ratios excluding lowest and highest 5%: |
2.1 |
|
|
|
|
|
|
|
|
|
|
| Pathway |
Source |
Scores of Genes |
p[Score] |
No. of Genes |
p[genes] |
Link to organ heatmap |
|
|
|
|
|
| mono-/sesqui-/di-terpene biosynthesis |
LitPath |
34 |
0.000 |
4 |
0.000 |
|
| terpenoid metabolism |
LitPath |
34 |
0.000 |
4 |
0.000 |
| Phenylpropanoid Metabolism |
BioPath |
20 |
0.000 |
4 |
0.001 |
| monoterpene biosynthesis |
LitPath |
20 |
0.000 |
2 |
0.000 |
| core phenylpropanoid metabolism |
BioPath |
14 |
0.000 |
3 |
0.000 |
| monoterpenoid biosynthesis |
TAIR-GO |
10 |
0.000 |
1 |
0.000 |
| monoterpene biosynthesis |
AraCyc |
10 |
0.000 |
1 |
0.000 |
|
|
|
|
|
|
|
|
|
| plant monoterpene biosynthesis |
AraCyc |
10 |
0.000 |
1 |
0.000 |
|
|
|
|
|
|
|
|
|
|
|
|
|
|
|
|
|
|
|
|
|
|
|
|
|
|
|
|
|
|
|
|
|
|
|
|
|
|
|
| Pathways co-expressed in the Hormone etc. data set (with more than 6 annotation points) |
|
CYP71B8 / CYP71B31 (At5g35715 / At3g53300) |
|
|
|
|
|
|
| max. difference between log2-ratios: |
5.8 |
|
|
|
|
|
|
|
|
|
|
| max. difference between log2-ratios excluding lowest and highest 5%: |
0.0 |
|
|
|
|
|
|
|
|
|
|
| Pathway |
Source |
Scores of Genes |
p[Score] |
No. of Genes |
p[genes] |
Link to hormones etc. heatmap |
|
|
|
|
|
| Cell Wall Carbohydrate Metabolism |
BioPath |
97 |
0.000 |
25 |
0.000 |
|
|
|
|
| pectin metabolism |
BioPath |
75 |
0.000 |
21 |
0.000 |
|
|
|
| mono-/sesqui-/di-terpene biosynthesis |
LitPath |
54 |
0.000 |
6 |
0.000 |
|
|
|
| terpenoid metabolism |
LitPath |
54 |
0.000 |
6 |
0.000 |
|
|
|
| Miscellaneous acyl lipid metabolism |
AcylLipid |
48 |
0.000 |
18 |
0.000 |
|
|
|
| Starch and sucrose metabolism |
KEGG |
42 |
0.000 |
6 |
0.000 |
|
|
|
| Phenylpropanoid Metabolism |
BioPath |
24 |
0.010 |
4 |
0.322 |
|
|
|
| Phenylpropanoid pathway |
LitPath |
24 |
0.016 |
4 |
0.117 |
|
|
|
| Fatty acid elongation and wax and cutin metabolism |
AcylLipid |
23 |
0.000 |
7 |
0.012 |
|
|
|
| core phenylpropanoid metabolism |
BioPath |
22 |
0.000 |
3 |
0.016 |
|
|
|
| sexual reproduction |
TAIR-GO |
20 |
0.000 |
5 |
0.000 |
|
|
|
| monoterpene biosynthesis |
LitPath |
20 |
0.000 |
2 |
0.000 |
|
|
|
| sucrose metabolism |
BioPath |
16 |
0.000 |
2 |
0.008 |
|
|
|
|
|
|
|
|
|
| biogenesis of cell wall |
FunCat |
16 |
0.000 |
7 |
0.000 |
|
|
|
|
|
|
|
|
|
| Galactose metabolism |
KEGG |
16 |
0.000 |
2 |
0.004 |
|
|
|
|
|
|
|
|
|
| C-compound and carbohydrate utilization |
FunCat |
14 |
0.000 |
2 |
0.000 |
|
|
|
|
|
|
|
|
|
| fatty acid metabolism |
TAIR-GO |
13 |
0.000 |
2 |
0.002 |
|
|
|
|
|
|
|
|
|
| Oxidative phosphorylation |
KEGG |
12 |
0.000 |
3 |
0.006 |
|
|
|
|
|
|
|
|
|
| jasmonic acid biosynthesis |
TAIR-GO |
10 |
0.000 |
1 |
0.018 |
|
|
|
|
|
|
|
|
|
| jasmonic acid mediated signaling pathway |
TAIR-GO |
10 |
0.000 |
1 |
0.000 |
|
|
|
|
|
|
|
|
|
| jasmonic acid metabolism |
TAIR-GO |
10 |
0.000 |
1 |
0.000 |
|
|
|
|
|
|
|
|
|
| monoterpenoid biosynthesis |
TAIR-GO |
10 |
0.000 |
1 |
0.001 |
|
|
|
|
|
|
|
|
|
| N-terminal protein myristoylation |
TAIR-GO |
10 |
0.000 |
1 |
0.006 |
|
|
|
|
|
|
|
|
|
| pentacyclic triterpenoid biosynthesis |
TAIR-GO |
10 |
0.000 |
1 |
0.003 |
|
|
|
|
|
|
|
|
|
| response to wounding |
TAIR-GO |
10 |
0.000 |
1 |
0.024 |
|
|
|
|
|
|
|
|
|
| jasmonic acid biosynthesis |
AraCyc |
10 |
0.000 |
1 |
0.004 |
|
|
|
|
|
|
|
|
|
| monoterpene biosynthesis |
AraCyc |
10 |
0.000 |
1 |
0.000 |
|
|
|
|
|
|
|
|
|
| plant monoterpene biosynthesis |
AraCyc |
10 |
0.000 |
1 |
0.000 |
|
|
|
|
|
|
|
|
|
| C-compound, carbohydrate catabolism |
FunCat |
10 |
0.000 |
3 |
0.005 |
|
|
|
|
|
|
|
|
|
| Biosynthesis of steroids |
KEGG |
10 |
0.000 |
1 |
0.080 |
|
|
|
|
|
|
|
|
|
| sequiterpene biosynthesis |
LitPath |
10 |
0.000 |
1 |
0.001 |
|
|
|
|
|
|
|
|
|
| triterpene biosynthesis |
LitPath |
10 |
0.000 |
1 |
0.042 |
|
|
|
|
|
|
|
|
|
| cellulose biosynthesis |
AraCyc |
8 |
0.000 |
2 |
0.002 |
|
|
|
|
|
|
|
|
|
| lactose degradation IV |
AraCyc |
8 |
0.000 |
2 |
0.000 |
|
|
|
|
|
|
|
|
|
| transport |
FunCat |
8 |
0.000 |
3 |
0.000 |
|
|
|
|
|
|
|
|
|
| Pentose and glucuronate interconversions |
KEGG |
8 |
0.000 |
2 |
0.000 |
|
|
|
|
|
|
|
|
|
|
|
|
|
|
|
|
|
|
|
|
|
|
|
|
|
|
|
|
|
|
|
|
|
|
|
|
|
|
|
|
|
|
|
|
|
|
|
|
|
|
|
|
|
|
| Pathways co-expressed in the Mutant data set (with more than 6 annotation points) |
|
CYP71B8 / CYP71B31 (At5g35715 / At3g53300) |
|
|
|
|
|
|
| max. difference between log2-ratios: |
4.3 |
|
|
|
|
|
|
|
|
|
|
| max. difference between log2-ratios excluding lowest and highest 5%: |
0.0 |
|
|
|
|
|
|
|
|
|
|
| Pathway |
Source |
Scores of Genes |
p[Score] |
No. of Genes |
p[genes] |
Link to mutants heatmap |
|
|
|
|
|
| Flavonoid and anthocyanin metabolism |
BioPath |
11 |
0.000 |
2 |
0.000 |

|
|
| Phenylpropanoid Metabolism |
BioPath |
11 |
0.000 |
2 |
0.001 |
|
| monoterpenoid biosynthesis |
TAIR-GO |
10 |
0.000 |
1 |
0.000 |
|
| proanthocyanidin biosynthesis |
TAIR-GO |
10 |
0.000 |
1 |
0.000 |
|
|
|
|
|
|
|
|
|
| anthocyanin biosynthesis |
AraCyc |
10 |
0.000 |
1 |
0.000 |
|
|
|
|
|
|
|
|
|
| monoterpene biosynthesis |
AraCyc |
10 |
0.000 |
1 |
0.000 |
|
|
|
|
|
|
|
|
|
| plant monoterpene biosynthesis |
AraCyc |
10 |
0.000 |
1 |
0.000 |
|
|
|
|
|
|
|
|
|
| flavonoid, anthocyanin, and proanthocyanidin biosynthesis |
LitPath |
10 |
0.000 |
1 |
0.001 |
|
|
|
|
|
|
|
|
|
| mono-/sesqui-/di-terpene biosynthesis |
LitPath |
10 |
0.000 |
1 |
0.011 |
|
|
|
|
|
|
|
|
|
| proanthocyanidin biosynthesis |
LitPath |
10 |
0.000 |
1 |
0.001 |
|
|
|
|
|
|
|
|
|
| terpenoid metabolism |
LitPath |
10 |
0.000 |
1 |
0.012 |
|
|
|
|
|
|
|
|
|
|
|
|
|
|
|
|
|
|
|
|
|
|
|
|