|
|
|
|
|
|
|
|
|
|
|
|
|
|
|
|
|
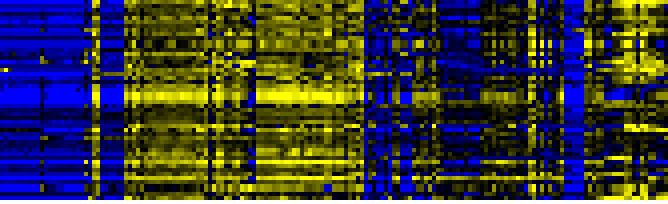
| Pathways co-expressed in the Organ and Tissue data set (with more than 17 annotation points) |
|
CYP72A13 / CYP72A11 (At1g1466 / At3g14650) |
|
|
|
|
|
|
|
|
| max. difference between log2-ratios: |
6.9 |
|
|
|
|
|
|
|
|
|
|
|
|
| max. difference between log2-ratios excluding lowest and highest 5%: |
6.0 |
|
|
|
|
|
|
|
|
|
|
|
|
| Pathway |
Source |
Scores of Genes |
p[Score] |
No. of Genes |
p[genes] |
Link to organ heatmap |
|
|
|
|
|
|
|
| Plastidial Isoprenoids (Chlorophylls, Carotenoids, Tocopherols, Plastoquinone, Phylloquinone) |
BioPath |
92 |
0.000 |
12 |
0.000 |
|
|
|
| Phenylpropanoid Metabolism |
BioPath |
63 |
0.002 |
8 |
0.300 |
|
|
| Carotenoid and abscisic acid metabolism |
LitPath |
55 |
0.000 |
8 |
0.000 |
|
|
| Folding, Sorting and Degradation |
KEGG |
51 |
0.000 |
7 |
0.001 |
|
|
| biogenesis of chloroplast |
FunCat |
46 |
0.000 |
7 |
0.000 |
|
|
| Biosynthesis of steroids |
KEGG |
46 |
0.000 |
6 |
0.000 |
|
|
| Carotenoid biosynthesis |
BioPath |
44 |
0.000 |
5 |
0.000 |
|
|
| carotenoid biosynthesis |
AraCyc |
44 |
0.000 |
5 |
0.000 |
|
|
| carotenid biosynthesis |
LitPath |
44 |
0.000 |
5 |
0.000 |
|
|
| Glucosyltransferases for benzoic acids |
BioPath |
40 |
0.000 |
4 |
0.000 |
|
|
| ATP-dependent proteolysis |
TAIR-GO |
38 |
0.000 |
8 |
0.000 |
|
|
| Biosynthesis of prenyl diphosphates |
BioPath |
34 |
0.000 |
5 |
0.009 |
|
|
| Chloroplastic protein turnover |
BioPath |
34 |
0.000 |
7 |
0.000 |
|
|
|
|
|
|
|
|
|
|
|
| Pathway for nuclear-encoded, thylakoid-localized proteins |
BioPath |
34 |
0.000 |
4 |
0.000 |
|
|
|
|
|
|
|
|
|
|
|
| Protein export |
KEGG |
34 |
0.000 |
4 |
0.000 |
|
|
|
|
|
|
|
|
|
|
|
| ClpP protease complex |
BioPath |
24 |
0.000 |
6 |
0.000 |
|
|
|
|
|
|
|
|
|
|
|
| Miscellaneous acyl lipid metabolism |
AcylLipid |
24 |
0.000 |
5 |
0.027 |
|
|
|
|
|
|
|
|
|
|
|
| C-compound and carbohydrate utilization |
FunCat |
22 |
0.000 |
3 |
0.000 |
|
|
|
|
|
|
|
|
|
|
|
| degradation |
FunCat |
21 |
0.000 |
4 |
0.001 |
|
|
|
|
|
|
|
|
|
|
|
| protein degradation |
FunCat |
21 |
0.000 |
4 |
0.000 |
|
|
|
|
|
|
|
|
|
|
|
| IPP (isopentenyl diphosphate) and DMAPP (dimethylallyl diphosphat) biosynthesis |
LitPath |
20 |
0.000 |
3 |
0.016 |
|
|
|
|
|
|
|
|
|
|
|
| MEP (methylerythritol P) pathway, plastids |
LitPath |
20 |
0.000 |
3 |
0.001 |
|
|
|
|
|
|
|
|
|
|
|
| carotene biosynthesis |
TAIR-GO |
18 |
0.000 |
2 |
0.000 |
|
|
|
|
|
|
|
|
|
|
|
| xanthophyll cycle |
AraCyc |
18 |
0.000 |
2 |
0.000 |
|
|
|
|
|
|
|
|
|
|
|
| Glyoxylate and dicarboxylate metabolism |
KEGG |
18 |
0.000 |
4 |
0.000 |
|
|
|
|
|
|
|
|
|
|
|
| Tryptophan metabolism |
KEGG |
18 |
0.000 |
3 |
0.004 |
|
|
|
|
|
|
|
|
|
|
|
|
|
|
|
|
|
|
|
|
|
|
|
|
|
|
|
|
|
|
|
|
|
|
|
|
|
|
|
|
|
|
|
|
|
| Pathways co-expressed in the Hormone etc. data set (with more than 10 annotation points) |
|
CYP72A13 / CYP72A11 (At1g1466 / At3g14650) |
|
|
|
|
|
|
|
|
| max. difference between log2-ratios: |
5.1 |
|
|
|
|
|
|
|
|
|
|
|
|
| max. difference between log2-ratios excluding lowest and highest 5%: |
3.6 |
|
|
|
|
|
|
|
|
|
|
|
|
| Pathway |
Source |
Scores of Genes |
p[Score] |
No. of Genes |
p[genes] |
Link to hormones etc. heatmap |
|
|
|
|
|
|
|
| Transporters required for plastid development |
BioPath |
10 |
0.000 |
1 |
0.000 |

|
|
|
|
|
|
| iron ion homeostasis |
TAIR-GO |
10 |
0.000 |
1 |
0.000 |
|
|
|
|
|
|
|
|
|
|
|
| cation transport (Na, K, Ca , NH4, etc.) |
FunCat |
10 |
0.000 |
1 |
0.000 |
|
|
|
|
|
|
|
|
|
|
|
| heavy metal ion transport (Cu, Fe, etc.) |
FunCat |
10 |
0.000 |
1 |
0.000 |
|
|
|
|
|
|
|
|
|
|
|
| ion transport |
FunCat |
10 |
0.000 |
1 |
0.000 |
|
|
|
|
|
|
|
|
|
|
|
| transport |
FunCat |
10 |
0.000 |
1 |
0.000 |
|
|
|
|
|
|
|
|
|
|
|
| transport facilitation |
FunCat |
10 |
0.000 |
1 |
0.000 |
|
|
|
|
|
|
|
|
|
|
|
| transported compounds (substrates) |
FunCat |
10 |
0.000 |
1 |
0.000 |
|
|
|
|
|
|
|
|
|
|
|
|
|
|
|
|
|
|
|
|
|
|
|
|
|
|
|
|