| _________________________________________ |
|
|
|
|
|
|
|
|
|
|
|
|
|
|
|
|
| Pathways co-expressed in all 4 data sets (with more than 6 annotation points each) |
|
Find below a list of pathways that are co-expressed with the bait. First a list of pathways is given that are co-expressed in all data sets. Lists for each individual dataset are shown underneath. Depending on the number of co-expressed pathways only the top scoring pathways are given; all data can be saved as text using the link above. |
|
|
|
|
|
|
|
|
| Pathway |
Source |
Sum of scores |
Sum of genes |
|
|
|
|
|
|
|
|
| Cell Wall Carbohydrate Metabolism |
BioPath |
352 |
106 |
|
|
|
|
|
|
|
|
| pectin metabolism |
BioPath |
167 |
72 |
|
|
|
|
|
|
|
|
| Flavonoid and anthocyanin metabolism |
BioPath |
67 |
15 |
|
|
|
|
|
|
|
|
| proanthocyanidin biosynthesis |
TAIR-GO |
46 |
5 |
|
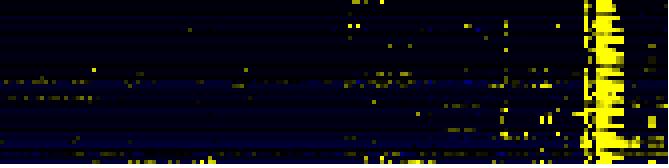
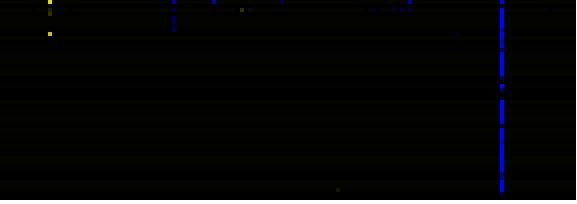
To the right of each table a thumbnail of the actual co-expression heatmap is given. Klick on the link to see the heatmap containing all co-expressed genes. |
|
|
|
|
|
|
|
| flavonoid biosynthesis |
TAIR-GO |
26 |
5 |
|
|
|
|
|
|
|
|
|
|
|
|
|
|
|
|
|
|
|
|
|
|
|
|
|
|
|
|
|
For more information on how these pathway maps were generated please read the methods page |
|
|
|
|
|
|
|
|
|
|
|
|
|
|
|
|
|
|
|
|
|
|
|
|
|
|
|
|
|
|
|
|
|
|
|
|
|
|
|
|
|
|
|
|
|
|
|
|
|
|
|
|
|
|
|
|
|
| Pathways co-expressed in the Organ and Tissue data set (with more than 9 annotation points) |
|
CYP76G1 (At3g52970) |
|
|
|
|
|
|
|
|
| max. difference between log2-ratios: |
4.2 |
|
|
|
|
|
|
|
|
|
|
|
|
| max. difference between log2-ratios excluding lowest and highest 5%: |
1.0 |
|
|
|
|
|
|
|
|
|
|
|
|
| Pathway |
Source |
Scores of Genes |
p[Score] |
No. of Genes |
p[genes] |
Link to organ heatmap |
|
|
|
|
|
|
|
| Cell Wall Carbohydrate Metabolism |
BioPath |
26 |
0.000 |
7 |
0.028 |
|
|
|
| Phenylpropanoid Metabolism |
BioPath |
24 |
0.000 |
5 |
0.011 |
|
|
| Flavonoid and anthocyanin metabolism |
BioPath |
20 |
0.000 |
3 |
0.003 |
|
|
| Gibberellin metabolism |
LitPath |
14 |
0.000 |
3 |
0.000 |
|
|
| giberelin biosynthesis |
LitPath |
14 |
0.000 |
3 |
0.000 |
|
|
| Stilbene, coumarine and lignin biosynthesis |
KEGG |
12 |
0.000 |
2 |
0.013 |
|
|
| Biosynthesis of prenyl diphosphates |
BioPath |
10 |
0.000 |
1 |
0.087 |
|
|
| Isoprenoid Biosynthesis in the Cytosol and in Mitochondria |
BioPath |
10 |
0.003 |
1 |
0.158 |
|
|
| pectin metabolism |
BioPath |
10 |
0.001 |
4 |
0.024 |
|
|
| trehalose metabolism |
BioPath |
10 |
0.000 |
2 |
0.000 |
|
|
| dolichol biosynthesis |
TAIR-GO |
10 |
0.000 |
1 |
0.000 |
|
|
| proanthocyanidin biosynthesis |
TAIR-GO |
10 |
0.000 |
1 |
0.000 |
|
|
|
|
|
|
|
|
|
|
|
| anthocyanin biosynthesis |
AraCyc |
10 |
0.000 |
1 |
0.001 |
|
|
|
|
|
|
|
|
|
|
|
| trehalose biosynthesis I |
AraCyc |
10 |
0.000 |
2 |
0.007 |
|
|
|
|
|
|
|
|
|
|
|
| trehalose biosynthesis II |
AraCyc |
10 |
0.000 |
2 |
0.003 |
|
|
|
|
|
|
|
|
|
|
|
| trehalose biosynthesis III |
AraCyc |
10 |
0.000 |
2 |
0.001 |
|
|
|
|
|
|
|
|
|
|
|
| energy |
FunCat |
10 |
0.000 |
2 |
0.000 |
|
|
|
|
|
|
|
|
|
|
|
| metabolism of energy reserves (e.g. glycogen, trehalose) |
FunCat |
10 |
0.000 |
2 |
0.000 |
|
|
|
|
|
|
|
|
|
|
|
| Ascorbate and aldarate metabolism |
KEGG |
10 |
0.000 |
1 |
0.007 |
|
|
|
|
|
|
|
|
|
|
|
| Fluorene degradation |
KEGG |
10 |
0.000 |
1 |
0.003 |
|
|
|
|
|
|
|
|
|
|
|
| gamma-Hexachlorocyclohexane degradation |
KEGG |
10 |
0.000 |
1 |
0.003 |
|
|
|
|
|
|
|
|
|
|
|
| flavonoid, anthocyanin, and proanthocyanidin biosynthesis |
LitPath |
10 |
0.000 |
1 |
0.020 |
|
|
|
|
|
|
|
|
|
|
|
| polyprenyl diphosphate biosynthesis |
LitPath |
10 |
0.000 |
1 |
0.010 |
|
|
|
|
|
|
|
|
|
|
|
| proanthocyanidin biosynthesis |
LitPath |
10 |
0.000 |
1 |
0.020 |
|
|
|
|
|
|
|
|
|
|
|
|
|
|
|
|
|
|
|
|
|
|
|
|
|
|
|
|
|
|
|
|
|
|
|
|
|
|
|
|
|
|
|
|
|
| Pathways co-expressed in the Hormone etc. data set (with more than 15 annotation points) |
|
CYP76G1 (At3g52970) |
|
|
|
|
|
|
|
|
| max. difference between log2-ratios: |
0.9 |
|
|
|
|
|
|
|
|
|
|
|
|
| max. difference between log2-ratios excluding lowest and highest 5%: |
0.0 |
|
|
|
|
|
|
|
|
|
|
|
|
| Pathway |
Source |
Scores of Genes |
p[Score] |
No. of Genes |
p[genes] |
Link to hormones etc. heatmap |
|
|
|
|
|
|
|
| Cell Wall Carbohydrate Metabolism |
BioPath |
96 |
0.000 |
33 |
0.000 |

|
|
|
|
|
|
| pectin metabolism |
BioPath |
64 |
0.000 |
26 |
0.000 |
|
|
|
|
|
| Ribosome |
KEGG |
36 |
0.027 |
6 |
0.488 |
|
|
|
|
|
| Intermediary Carbon Metabolism |
BioPath |
26 |
0.011 |
6 |
0.360 |
|
|
|
|
|
| nucleotide metabolism |
FunCat |
22 |
0.000 |
5 |
0.000 |
|
|
|
|
|
| mono-/sesqui-/di-terpene biosynthesis |
LitPath |
22 |
0.000 |
4 |
0.015 |
|
|
|
|
|
| terpenoid metabolism |
LitPath |
22 |
0.000 |
4 |
0.018 |
|
|
|
|
|
| (deoxy)ribose phosphate degradation |
AraCyc |
20 |
0.000 |
4 |
0.000 |
|
|
|
|
|
| biosynthesis of derivatives of homoisopentenyl pyrophosphate |
FunCat |
20 |
0.000 |
2 |
0.016 |
|
|
|
|
|
| pyrimidine nucleotide metabolism |
FunCat |
20 |
0.000 |
4 |
0.000 |
|
|
|
|
|
| Nucleotide Metabolism |
KEGG |
20 |
0.000 |
4 |
0.046 |
|
|
|
|
|
| Pyrimidine metabolism |
KEGG |
20 |
0.000 |
4 |
0.003 |
|
|
|
|
|
| Miscellaneous acyl lipid metabolism |
AcylLipid |
20 |
0.002 |
8 |
0.059 |
|
|
|
|
|
| Fatty acid elongation and wax and cutin metabolism |
AcylLipid |
19 |
0.000 |
6 |
0.004 |
|
|
|
|
|
|
|
|
|
|
|
| Flavonoid and anthocyanin metabolism |
BioPath |
18 |
0.000 |
4 |
0.050 |
|
|
|
|
|
|
|
|
|
|
|
| biogenesis of cell wall |
FunCat |
16 |
0.002 |
6 |
0.008 |
|
|
|
|
|
|
|
|
|
|
|
| Glycolysis / Gluconeogenesis |
KEGG |
16 |
0.003 |
4 |
0.048 |
|
|
|
|
|
|
|
|
|
|
|
|
|
|
|
|
|
|
|
|
|
|
|
|
|
|
|
|
|
|
|
|
|
|
|
|
|
|
|
|
|
|
|
|
|
|
|
|
|
|
|
|
|
|
|
|
|
|
|
|
|
|
| Pathways co-expressed in the Mutant data set (with more than 30 annotation points) |
|
CYP76G1 (At3g52970) |
|
|
|
|
|
|
|
|
| max. difference between log2-ratios: |
10.2 |
|
|
|
|
|
|
|
|
|
|
|
|
| max. difference between log2-ratios excluding lowest and highest 5%: |
0.0 |
|
|
|
|
|
|
|
|
|
|
|
|
| Pathway |
Source |
Scores of Genes |
p[Score] |
No. of Genes |
p[genes] |
Link to mutants heatmap |
|
|
|
|
|
|
|
| Cell Wall Carbohydrate Metabolism |
BioPath |
229.5 |
0.000 |
66 |
0.000 |
|
|
|
|
| C-compound and carbohydrate metabolism |
FunCat |
123 |
0.000 |
31 |
0.027 |
|
|
|
| Phenylpropanoid Metabolism |
BioPath |
97 |
0.035 |
19 |
0.465 |
|
|
|
| pectin metabolism |
BioPath |
92.5 |
0.000 |
42 |
0.000 |
|
|
|
| Isoprenoid Biosynthesis in the Cytosol and in Mitochondria |
BioPath |
58 |
0.001 |
10 |
0.087 |
|
|
|
| mono-/sesqui-/di-terpene biosynthesis |
LitPath |
58 |
0.000 |
10 |
0.003 |
|
|
|
| terpenoid metabolism |
LitPath |
58 |
0.000 |
10 |
0.004 |
|
|
|
| glycolysis and gluconeogenesis |
FunCat |
56 |
0.019 |
13 |
0.132 |
|
|
|
| Nucleotide Metabolism |
KEGG |
53 |
0.000 |
10 |
0.039 |
|
|
|
| Starch and sucrose metabolism |
KEGG |
51 |
0.000 |
12 |
0.006 |
|
|
|
| Purine metabolism |
KEGG |
43 |
0.000 |
8 |
0.048 |
|
|
|
| Pyruvate metabolism |
KEGG |
43 |
0.001 |
8 |
0.121 |
|
|
|
| Aromatic amino acid (Phe, Tyr, Trp) metabolism |
BioPath |
42 |
0.002 |
5 |
0.592 |
|
|
|
| cellulose biosynthesis |
BioPath |
42 |
0.000 |
8 |
0.057 |
|
|
|
|
|
|
|
|
|
|
|
| Biosynthesis of prenyl diphosphates |
BioPath |
40 |
0.005 |
7 |
0.111 |
|
|
|
|
|
|
|
|
|
|
|
| transport |
FunCat |
40 |
0.000 |
11 |
0.000 |
|
|
|
|
|
|
|
|
|
|
|
| biogenesis of cell wall |
FunCat |
38 |
0.000 |
13 |
0.001 |
|
|
|
|
|
|
|
|
|
|
|
| trans-zeatin biosynthesis |
AraCyc |
36 |
0.000 |
7 |
0.000 |
|
|
|
|
|
|
|
|
|
|
|
| transport facilitation |
FunCat |
36 |
0.000 |
10 |
0.000 |
|
|
|
|
|
|
|
|
|
|
|
| Phenylalanine, tyrosine and tryptophan biosynthesis |
KEGG |
36 |
0.000 |
4 |
0.261 |
|
|
|
|
|
|
|
|
|
|
|
| Translation factors |
KEGG |
36 |
0.001 |
12 |
0.019 |
|
|
|
|
|
|
|
|
|
|
|
| acetate fermentation |
AraCyc |
34 |
0.003 |
9 |
0.070 |
|
|
|
|
|
|
|
|
|
|
|
| nucleotide metabolism |
FunCat |
34 |
0.000 |
7 |
0.000 |
|
|
|
|
|
|
|
|
|
|
|
| brassinosteroid biosynthesis |
LitPath |
33 |
0.002 |
4 |
0.195 |
|
|
|
|
|
|
|
|
|
|
|
| fructose degradation (anaerobic) |
AraCyc |
32 |
0.004 |
9 |
0.045 |
|
|
|
|
|
|
|
|
|
|
|
| glycolysis IV |
AraCyc |
32 |
0.005 |
9 |
0.050 |
|
|
|
|
|
|
|
|
|
|
|
| sorbitol fermentation |
AraCyc |
32 |
0.011 |
9 |
0.059 |
|
|
|
|
|
|
|
|
|
|
|
| Pyrimidine metabolism |
KEGG |
32 |
0.000 |
7 |
0.013 |
|
|
|
|
|
|
|
|
|
|
|
| lactose degradation IV |
AraCyc |
31 |
0.000 |
8 |
0.000 |
|
|
|
|
|
|
|
|
|
|
|
|
|
|
|
|
|
|
|
|
|
|
|
|
|
|
|
|