|
|
|
|
|
|
|
|
|
|
|
|
|
|
|
|
|
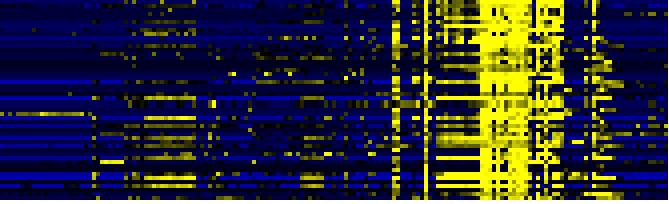
| Pathways co-expressed in the Organ and Tissue data set (with more than 6 annotation points) |
|
CYP77A6 (At3g10570) |
|
|
|
|
|
|
|
|
| max. difference between log2-ratios: |
8.2 |
|
|
|
|
|
|
|
|
|
|
|
|
| max. difference between log2-ratios excluding lowest and highest 5%: |
5.7 |
|
|
|
|
|
|
|
|
|
|
|
|
| Pathway |
Source |
Scores of Genes |
p[Score] |
No. of Genes |
p[genes] |
Link to organ heatmap |
|
|
|
|
|
|
|
| Miscellaneous acyl lipid metabolism |
AcylLipid |
64 |
0.000 |
17 |
0.000 |
|
|
|
| Cell Wall Carbohydrate Metabolism |
BioPath |
41 |
0.000 |
10 |
0.003 |
|
|
| pectin metabolism |
BioPath |
39 |
0.000 |
9 |
0.000 |
|
|
| Fatty acid elongation and wax and cutin metabolism |
AcylLipid |
32 |
0.000 |
7 |
0.012 |
|
|
| mono-/sesqui-/di-terpene biosynthesis |
LitPath |
30 |
0.000 |
3 |
0.003 |
|
|
| terpenoid metabolism |
LitPath |
30 |
0.000 |
3 |
0.004 |
|
|
| Starch and sucrose metabolism |
KEGG |
26 |
0.000 |
4 |
0.000 |
|
|
| Gluconeogenesis from lipids in seeds |
BioPath |
20 |
0.000 |
2 |
0.059 |
|
|
| sexual reproduction |
TAIR-GO |
20 |
0.000 |
5 |
0.000 |
|
|
| fatty acid oxidation pathway |
AraCyc |
20 |
0.000 |
2 |
0.000 |
|
|
| octane oxidation |
AraCyc |
20 |
0.000 |
2 |
0.000 |
|
|
| fatty acid metabolism |
TAIR-GO |
18 |
0.000 |
2 |
0.002 |
|
|
| cellulose biosynthesis |
AraCyc |
12 |
0.000 |
3 |
0.000 |
|
|
| cutin biosynthesis |
TAIR-GO |
10 |
0.000 |
1 |
0.000 |
|
|
|
|
|
|
|
|
|
|
|
| fatty acid biosynthesis |
TAIR-GO |
10 |
0.000 |
1 |
0.011 |
|
|
|
|
|
|
|
|
|
|
|
| monoterpenoid biosynthesis |
TAIR-GO |
10 |
0.000 |
1 |
0.001 |
|
|
|
|
|
|
|
|
|
|
|
| pentacyclic triterpenoid biosynthesis |
TAIR-GO |
10 |
0.000 |
1 |
0.003 |
|
|
|
|
|
|
|
|
|
|
|
| monoterpene biosynthesis |
AraCyc |
10 |
0.000 |
1 |
0.000 |
|
|
|
|
|
|
|
|
|
|
|
| plant monoterpene biosynthesis |
AraCyc |
10 |
0.000 |
1 |
0.000 |
|
|
|
|
|
|
|
|
|
|
|
| Biosynthesis of steroids |
KEGG |
10 |
0.000 |
1 |
0.025 |
|
|
|
|
|
|
|
|
|
|
|
| Fatty acid metabolism |
KEGG |
10 |
0.000 |
1 |
0.014 |
|
|
|
|
|
|
|
|
|
|
|
| monoterpene biosynthesis |
LitPath |
10 |
0.000 |
1 |
0.004 |
|
|
|
|
|
|
|
|
|
|
|
| sequiterpene biosynthesis |
LitPath |
10 |
0.000 |
1 |
0.000 |
|
|
|
|
|
|
|
|
|
|
|
| triterpene biosynthesis |
LitPath |
10 |
0.000 |
1 |
0.019 |
|
|
|
|
|
|
|
|
|
|
|
| C-compound and carbohydrate utilization |
FunCat |
8 |
0.000 |
2 |
0.000 |
|
|
|
|
|
|
|
|
|
|
|
| cuticle biosynthesis |
TAIR-GO |
7 |
0.000 |
1 |
0.007 |
|
|
|
|
|
|
|
|
|
|
|
| wax biosynthesis |
TAIR-GO |
7 |
0.000 |
1 |
0.002 |
|
|
|
|
|
|
|
|
|
|
|
| epicuticular wax biosynthesis |
AraCyc |
7 |
0.000 |
1 |
0.000 |
|
|
|
|
|
|
|
|
|
|
|
|
|
|
|
|
|
|
|
|
|
|
|
|
|
|
|
|
|
|
|
|
|
|
|
|
|
|
|
|
|
|
|
|
|
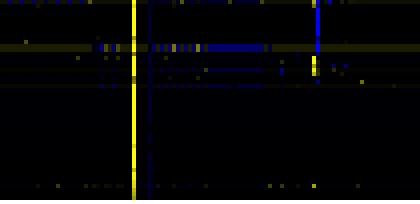
| Pathways co-expressed in the Hormone etc. data set (with more than 10 annotation points) |
|
CYP77A6 (At3g10570) |
|
|
|
|
|
|
|
|
| max. difference between log2-ratios: |
6.4 |
|
|
|
|
|
|
|
|
|
|
|
|
| max. difference between log2-ratios excluding lowest and highest 5%: |
1.8 |
|
|
|
|
|
|
|
|
|
|
|
|
| Pathway |
Source |
Scores of Genes |
p[Score] |
No. of Genes |
p[genes] |
Link to hormones etc. heatmap |
|
|
|
|
|
|
|
| Cell Wall Carbohydrate Metabolism |
BioPath |
89 |
0.000 |
22 |
0.000 |
|
|
|
|
|
|
| pectin metabolism |
BioPath |
67 |
0.000 |
18 |
0.000 |
|
|
|
|
|
| Starch and sucrose metabolism |
KEGG |
42 |
0.000 |
6 |
0.000 |
|
|
|
|
|
| mono-/sesqui-/di-terpene biosynthesis |
LitPath |
40 |
0.000 |
4 |
0.000 |
|
|
|
|
|
| terpenoid metabolism |
LitPath |
40 |
0.000 |
4 |
0.000 |
|
|
|
|
|
| Miscellaneous acyl lipid metabolism |
AcylLipid |
26 |
0.000 |
10 |
0.000 |
|
|
|
|
|
| Lipid signaling |
AcylLipid |
20 |
0.010 |
2 |
0.806 |
|
|
|
|
|
| sucrose metabolism |
BioPath |
16 |
0.000 |
2 |
0.004 |
|
|
|
|
|
| Galactose metabolism |
KEGG |
16 |
0.000 |
2 |
0.001 |
|
|
|
|
|
| biogenesis of cell wall |
FunCat |
14 |
0.000 |
6 |
0.000 |
|
|
|
|
|
| C-compound and carbohydrate utilization |
FunCat |
14 |
0.000 |
2 |
0.000 |
|
|
|
|
|
| sexual reproduction |
TAIR-GO |
12 |
0.000 |
3 |
0.000 |
|
|
|
|
|
| Oxidative phosphorylation |
KEGG |
12 |
0.000 |
3 |
0.001 |
|
|
|
|
|
|
|
|
|
|
|
| jasmonic acid biosynthesis |
TAIR-GO |
10 |
0.000 |
1 |
0.011 |
|
|
|
|
|
|
|
|
|
|
|
| jasmonic acid mediated signaling pathway |
TAIR-GO |
10 |
0.000 |
1 |
0.000 |
|
|
|
|
|
|
|
|
|
|
|
| jasmonic acid metabolism |
TAIR-GO |
10 |
0.000 |
1 |
0.000 |
|
|
|
|
|
|
|
|
|
|
|
| monoterpenoid biosynthesis |
TAIR-GO |
10 |
0.000 |
1 |
0.000 |
|
|
|
|
|
|
|
|
|
|
|
| N-terminal protein myristoylation |
TAIR-GO |
10 |
0.000 |
1 |
0.004 |
|
|
|
|
|
|
|
|
|
|
|
| response to wounding |
TAIR-GO |
10 |
0.000 |
1 |
0.015 |
|
|
|
|
|
|
|
|
|
|
|
| jasmonic acid biosynthesis |
AraCyc |
10 |
0.000 |
1 |
0.001 |
|
|
|
|
|
|
|
|
|
|
|
| monoterpene biosynthesis |
AraCyc |
10 |
0.000 |
1 |
0.000 |
|
|
|
|
|
|
|
|
|
|
|
| plant monoterpene biosynthesis |
AraCyc |
10 |
0.000 |
1 |
0.000 |
|
|
|
|
|
|
|
|
|
|
|
| C-compound, carbohydrate catabolism |
FunCat |
10 |
0.000 |
3 |
0.001 |
|
|
|
|
|
|
|
|
|
|
|
| monoterpene biosynthesis |
LitPath |
10 |
0.000 |
1 |
0.002 |
|
|
|
|
|
|
|
|
|
|
|
| sequiterpene biosynthesis |
LitPath |
10 |
0.000 |
1 |
0.000 |
|
|
|
|
|
|
|
|
|
|
|
| cellulose biosynthesis |
AraCyc |
8 |
0.000 |
2 |
0.000 |
|
|
|
|
|
|
|
|
|
|
|
| lactose degradation IV |
AraCyc |
8 |
0.000 |
2 |
0.000 |
|
|
|
|
|
|
|
|
|
|
|
| Pentose and glucuronate interconversions |
KEGG |
8 |
0.000 |
2 |
0.000 |
|
|
|
|
|
|
|
|
|
|
|
|
|
|
|
|
|
|
|
|
|
|
|
|
|
|
|
|