|
|
|
|
|
|
|
|
|
|
|
|
|
|
|
|
|
| Pathways co-expressed in all four data set |
|
|
|
|
|
|
|
|
|
|
|
|
|
|
|
|
| Pathway |
Source |
Sum of scores |
Sum of genes |
|
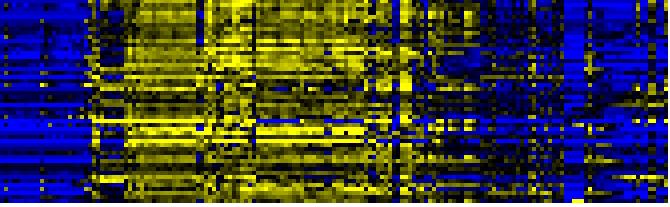
Find below a list of pathways that are co-expressed with the bait. First a list of pathways is given that are co-expressed in all four data sets. Lists for each individual dataset are shown underneath. To the right of each table a thumbnail of the actual co-expression heatmap is given. Klick on the link to see the heatmap containing all co-expressed genes. |
|
|
|
|
|
|
|
|
|
| tryptophan biosynthesis |
TAIR-GO |
692 |
86 |
|
|
|
|
|
|
|
|
|
|
| tryptophan biosynthesis |
AraCyc |
684 |
86 |
|
|
|
|
|
|
|
|
|
|
| Phenylpropanoid Metabolism |
BioPath |
406 |
50 |
|
|
|
|
|
|
|
|
|
|
| Biosynthesis of Amino Acids and Derivatives |
BioPath |
286 |
36 |
|
|
|
|
|
|
|
|
|
|
| Shikimate pathway |
LitPath |
284 |
35 |
|
For more information on how these pathway maps were generated please read the methods page |
|
|
|
|
|
|
|
|
|
| Glucosinolate Metabolism |
LitPath |
280 |
28 |
|
|
|
|
|
|
|
|
|
|
| Aromatic amino acid (Phe, Tyr, Trp) metabolism |
BioPath |
278 |
34 |
|

|
|
|
|
|
|
|
|
|
|
|
| Glutathione metabolism |
BioPath |
260 |
33 |
|
|
|
|
|
|
|
|
|
|
|
| Trp biosyntesis |
LitPath |
250 |
31 |
|
|
|
|
|
|
|
|
|
|
|
| glucosinolate biosynthesis |
TAIR-GO |
230 |
23 |
|
|
|
|
|
|
|
|
|
|
|
| amino acid metabolism |
FunCat |
216 |
26 |
|
|
|
|
|
|
|
|
|
|
|
|
| Phenylalanine, tyrosine and tryptophan biosynthesis |
KEGG |
216 |
24 |
|
|
|
|
|
|
|
|
|
|
|
|
|
| jasmonic acid biosynthesis |
TAIR-GO |
150 |
19 |
|
|
|
|
|
|
|
|
|
|
|
|
|
| jasmonic acid biosynthesis |
AraCyc |
150 |
19 |
|
|
|
|
|
|
|
|
|
|
|
|
|
| sulfate assimilation |
TAIR-GO |
150 |
17 |
|
|
|
|
|
|
|
|
|
|
|
|
|
| IAA biosynthesis |
AraCyc |
140 |
14 |
|
|
|
|
|
|
|
|
|
|
|
|
|
| response to wounding |
TAIR-GO |
136 |
15 |
|
|
|
|
|
|
|
|
|
|
|
|
|
| Sulfur metabolism |
KEGG |
134 |
15 |
|
|
|
|
|
|
|
|
|
|
|
|
|
| sulfate assimilation III |
AraCyc |
130 |
16 |
|
|
|
|
|
|
|
|
|
|
|
|
|
| sulfate reduction |
TAIR-GO |
122 |
13 |
|
|
|
|
|
|
|
|
|
|
|
|
|
| glucosinolate biosynthesis from tryptophan |
AraCyc |
120 |
12 |
|
|
|
|
|
|
|
|
|
|
|
|
|
| Selenoamino acid metabolism |
KEGG |
116 |
13 |
|
|
|
|
|
|
|
|
|
|
|
|
|
| lignin biosynthesis |
TAIR-GO |
109 |
14 |
|
|
|
|
|
|
|
|
|
|
|
|
|
| lignin biosynthesis |
AraCyc |
109 |
14 |
|
|
|
|
|
|
|
|
|
|
|
|
|
| Purine metabolism |
KEGG |
90 |
9 |
|
|
|
|
|
|
|
|
|
|
|
|
|
| alanine biosynthesis II |
AraCyc |
86 |
11 |
|
|
|
|
|
|
|
|
|
|
|
|
|
| Stilbene, coumarine and lignin biosynthesis |
KEGG |
83 |
11 |
|
|
|
|
|
|
|
|
|
|
|
|
|
| Flavonoid and anthocyanin metabolism |
BioPath |
80 |
8 |
|
|
|
|
|
|
|
|
|
|
|
|
|
| tryptophan catabolism |
TAIR-GO |
80 |
8 |
|
|
|
|
|
|
|
|
|
|
|
|
|
| glucosinolate biosynthesis from phenylalanine |
AraCyc |
80 |
8 |
|
|
|
|
|
|
|
|
|
|
|
|
|
| IAA biosynthesis I |
AraCyc |
80 |
8 |
|
|
|
|
|
|
|
|
|
|
|
|
|
| indoleacetic acid biosynthesis |
TAIR-GO |
70 |
7 |
|
|
|
|
|
|
|
|
|
|
|
|
|
| dissimilatory sulfate reduction |
AraCyc |
68 |
8 |
|
|
|
|
|
|
|
|
|
|
|
|
|
| nitrogen and sulfur utilization |
FunCat |
62 |
7 |
|
|
|
|
|
|
|
|
|
|
|
|
|
| nucleotide metabolism |
FunCat |
52 |
6 |
|
|
|
|
|
|
|
|
|
|
|
|
|
| histidine biosynthesis |
AraCyc |
50 |
5 |
|
|
|
|
|
|
|
|
|
|
|
|
|
| Ascorbate and aldarate metabolism |
KEGG |
47 |
5 |
|
|
|
|
|
|
|
|
|
|
|
|
|
| Fluorene degradation |
KEGG |
47 |
5 |
|
|
|
|
|
|
|
|
|
|
|
|
|
| gamma-Hexachlorocyclohexane degradation |
KEGG |
47 |
5 |
|
|
|
|
|
|
|
|
|
|
|
|
|
| indole glucosinolate biosynthesis |
TAIR-GO |
40 |
4 |
|
|
|
|
|
|
|
|
|
|
|
|
|
| response to red light |
TAIR-GO |
40 |
4 |
|
|
|
|
|
|
|
|
|
|
|
|
|
| shade avoidance |
TAIR-GO |
40 |
4 |
|
|
|
|
|
|
|
|
|
|
|
|
|
| sulfate reduction, APS pathway |
TAIR-GO |
40 |
4 |
|
|
|
|
|
|
|
|
|
|
|
|
|
|
|
|
|
|
|
|
|
|
|
|
|
|
|
|
|
|
|
|
|
|
|
|
|
|
|
|
|
|
|
|
|
|
|
| Pathways co-expressed in the Organ and Tissue data set |
|
CYP79B2 (At4g39950) |
|
|
|
|
|
|
|
|
|
|
|
| max. difference between log2-ratios: |
6.45 |
|
|
|
|
|
|
|
|
|
|
|
|
|
|
|
| max. difference between log2-ratios excluding lowest and highest 5%: |
4.85 |
|
|
|
|
|
|
|
|
|
|
|
|
|
|
|
| Pathway |
Source |
Scores of Genes |
p[Score] |
No. of Genes |
p[genes] |
Link to organ heatmap |
|
|
|
|
|
|
|
| Glucosinolate Metabolism |
LitPath |
90 |
0.000 |
9 |
0.000 |
|
|
|
|
| Biosynthesis of Amino Acids and Derivatives |
BioPath |
88 |
0.000 |
11 |
0.000 |
|
|
|
| Phenylpropanoid Metabolism |
BioPath |
64 |
0.000 |
8 |
0.002 |
|
|
|
| Glutathione metabolism |
BioPath |
58 |
0.000 |
8 |
0.000 |
|
|
|
| sulfate assimilation III |
AraCyc |
36 |
0.000 |
5 |
0.000 |
|
|
|
| Flavonoid and anthocyanin metabolism |
BioPath |
30 |
0.000 |
3 |
0.013 |
|
|
|
| tryptophan biosynthesis |
TAIR-GO |
30 |
0.000 |
3 |
0.000 |
|
|
|
| glucosinolate biosynthesis from tryptophan |
AraCyc |
30 |
0.000 |
3 |
0.000 |
|
|
|
| amino acid metabolism |
FunCat |
30 |
0.000 |
4 |
0.000 |
|
|
|
| Phenylalanine, tyrosine and tryptophan biosynthesis |
KEGG |
30 |
0.000 |
3 |
0.001 |
|
|
|
| Selenoamino acid metabolism |
KEGG |
30 |
0.000 |
4 |
0.000 |
|
|
|
| Sulfur metabolism |
KEGG |
30 |
0.000 |
4 |
0.000 |
|
|
|
|
|
|
|
|
|
|
|
| Lipid signaling |
AcylLipid |
24 |
0.000 |
4 |
0.001 |
|
|
|
|
|
|
|
|
|
|
|
| jasmonic acid biosynthesis |
TAIR-GO |
22 |
0.000 |
3 |
0.000 |
|
|
|
|
|
|
|
|
|
|
|
| jasmonic acid biosynthesis |
AraCyc |
22 |
0.000 |
3 |
0.000 |
|
|
|
|
|
|
|
|
|
|
|
| tryptophan biosynthesis |
AraCyc |
22 |
0.000 |
3 |
0.001 |
|
|
|
|
|
|
|
|
|
|
|
| Stilbene, coumarine and lignin biosynthesis |
KEGG |
22 |
0.000 |
3 |
0.018 |
|
|
|
|
|
|
|
|
|
|
|
| Aromatic amino acid (Phe, Tyr, Trp) metabolism |
BioPath |
20 |
0.000 |
2 |
0.065 |
|
|
|
|
|
|
|
|
|
|
|
| glucosinolate biosynthesis |
TAIR-GO |
20 |
0.000 |
2 |
0.000 |
|
|
|
|
|
|
|
|
|
|
|
| indoleacetic acid biosynthesis |
TAIR-GO |
20 |
0.000 |
2 |
0.000 |
|
|
|
|
|
|
|
|
|
|
|
| tryptophan catabolism |
TAIR-GO |
20 |
0.000 |
2 |
0.000 |
|
|
|
|
|
|
|
|
|
|
|
| cysteine biosynthesis I |
AraCyc |
20 |
0.000 |
3 |
0.003 |
|
|
|
|
|
|
|
|
|
|
|
| glucosinolate biosynthesis from phenylalanine |
AraCyc |
20 |
0.000 |
2 |
0.000 |
|
|
|
|
|
|
|
|
|
|
|
| IAA biosynthesis |
AraCyc |
20 |
0.000 |
2 |
0.001 |
|
|
|
|
|
|
|
|
|
|
|
| IAA biosynthesis I |
AraCyc |
20 |
0.000 |
2 |
0.000 |
|
|
|
|
|
|
|
|
|
|
|
| Purine metabolism |
KEGG |
20 |
0.000 |
2 |
0.023 |
|
|
|
|
|
|
|
|
|
|
|
| Shikimate pathway |
LitPath |
20 |
0.000 |
2 |
0.072 |
|
|
|
|
|
|
|
|
|
|
|
| Trp biosyntesis |
LitPath |
20 |
0.000 |
2 |
0.007 |
|
|
|
|
|
|
|
|
|
|
|
| dissimilatory sulfate reduction |
AraCyc |
16 |
0.000 |
2 |
0.000 |
|
|
|
|
|
|
|
|
|
|
|
| lipoxygenase pathway |
AraCyc |
16 |
0.000 |
2 |
0.001 |
|
|
|
|
|
|
|
|
|
|
|
| nitrogen and sulfur utilization |
FunCat |
16 |
0.000 |
2 |
0.000 |
|
|
|
|
|
|
|
|
|
|
|
| core phenylpropanoid metabolism |
BioPath |
14 |
0.002 |
3 |
0.006 |
|
|
|
|
|
|
|
|
|
|
|
| C-compound and carbohydrate metabolism |
FunCat |
14 |
0.017 |
3 |
0.025 |
|
|
|
|
|
|
|
|
|
|
|
| glycolysis and gluconeogenesis |
FunCat |
12 |
0.000 |
2 |
0.014 |
|
|
|
|
|
|
|
|
|
|
|
| Phenylalanine metabolism |
KEGG |
12 |
0.000 |
2 |
0.059 |
|
|
|
|
|
|
|
|
|
|
|
|
|
|
|
|
|
|
|
|
|
|
|
|
|
|
|
|
|
|
|
|
|
|
|
|
|
|
|
|
|
|
|
|
|
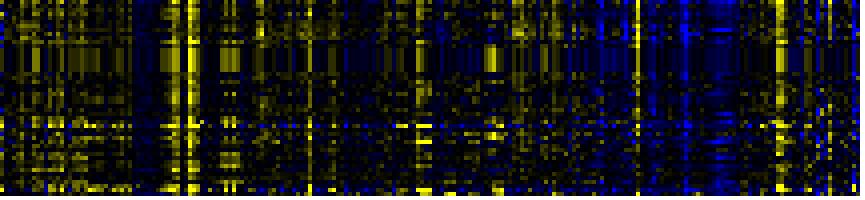
| Pathways co-expressed in the Stress data set |
|
CYP79B2 (At4g39950) |
|
|
|
|
|
|
|
|
|
|
|
| max. difference between log2-ratios: |
10.02 |
|
|
|
|
|
|
|
|
|
|
|
|
|
|
|
| max. difference between log2-ratios excluding lowest and highest 5%: |
3.65 |
|
|
|
|
|
|
|
|
|
|
|
|
|
|
|
| Pathway |
Source |
Scores of Genes |
p[Score] |
No. of Genes |
p[genes] |
|
|
|
|
|
|
|
|
|
|
|
| Phenylpropanoid Metabolism |
BioPath |
144 |
0.000 |
18 |
0.000 |
Link to stress heatmap |
|
|
|
|
|
|
|
| Aromatic amino acid (Phe, Tyr, Trp) metabolism |
BioPath |
102 |
0.000 |
13 |
0.000 |
|
| Shikimate pathway |
LitPath |
102 |
0.000 |
13 |
0.000 |
| tryptophan biosynthesis |
TAIR-GO |
98 |
0.000 |
12 |
0.000 |
| Trp biosyntesis |
LitPath |
88 |
0.000 |
11 |
0.000 |
| Biosynthesis of Amino Acids and Derivatives |
BioPath |
82 |
0.000 |
11 |
0.000 |
| Glutathione metabolism |
BioPath |
82 |
0.000 |
11 |
0.000 |
| tryptophan biosynthesis |
AraCyc |
80 |
0.000 |
11 |
0.000 |
| Phenylalanine, tyrosine and tryptophan biosynthesis |
KEGG |
72 |
0.000 |
8 |
0.000 |
| Glucosinolate Metabolism |
LitPath |
70 |
0.000 |
7 |
0.000 |
| response to pathogenic bacteria |
TAIR-GO |
58 |
0.000 |
8 |
0.000 |
| amino acid metabolism |
FunCat |
56 |
0.000 |
7 |
0.000 |
|
|
|
|
|
|
|
|
|
|
|
| sulfate assimilation III |
AraCyc |
48 |
0.000 |
6 |
0.000 |
|
|
|
|
|
|
|
|
|
|
|
| Sulfur metabolism |
KEGG |
45 |
0.000 |
5 |
0.000 |
|
|
|
|
|
|
|
|
|
|
|
| response to wounding |
TAIR-GO |
40 |
0.000 |
4 |
0.000 |
|
|
|
|
|
|
|
|
|
|
|
| Stilbene, coumarine and lignin biosynthesis |
KEGG |
39 |
0.000 |
5 |
0.002 |
|
|
|
|
|
|
|
|
|
|
|
| cysteine biosynthesis I |
AraCyc |
36 |
0.000 |
5 |
0.000 |
|
|
|
|
|
|
|
|
|
|
|
| Selenoamino acid metabolism |
KEGG |
36 |
0.000 |
4 |
0.000 |
|
|
|
|
|
|
|
|
|
|
|
| glucosinolate biosynthesis from tryptophan |
AraCyc |
30 |
0.000 |
3 |
0.000 |
|
|
|
|
|
|
|
|
|
|
|
| core phenylpropanoid metabolism |
BioPath |
22 |
0.000 |
3 |
0.018 |
|
|
|
|
|
|
|
|
|
|
|
| Flavonoid and anthocyanin metabolism |
BioPath |
20 |
0.000 |
2 |
0.126 |
|
|
|
|
|
|
|
|
|
|
|
| indoleacetic acid biosynthesis |
TAIR-GO |
20 |
0.000 |
2 |
0.000 |
|
|
|
|
|
|
|
|
|
|
|
| phenylpropanoid metabolism |
TAIR-GO |
20 |
0.000 |
2 |
0.001 |
|
|
|
|
|
|
|
|
|
|
|
| response to pathogenic fungi |
TAIR-GO |
20 |
0.000 |
2 |
0.000 |
|
|
|
|
|
|
|
|
|
|
|
| response to UV |
TAIR-GO |
20 |
0.000 |
2 |
0.006 |
|
|
|
|
|
|
|
|
|
|
|
| tryptophan catabolism |
TAIR-GO |
20 |
0.000 |
2 |
0.000 |
|
|
|
|
|
|
|
|
|
|
|
| flavonoid biosynthesis |
AraCyc |
20 |
0.000 |
2 |
0.008 |
|
|
|
|
|
|
|
|
|
|
|
| glucosinolate biosynthesis from phenylalanine |
AraCyc |
20 |
0.000 |
2 |
0.000 |
|
|
|
|
|
|
|
|
|
|
|
| IAA biosynthesis |
AraCyc |
20 |
0.000 |
2 |
0.001 |
|
|
|
|
|
|
|
|
|
|
|
| IAA biosynthesis I |
AraCyc |
20 |
0.000 |
2 |
0.000 |
|
|
|
|
|
|
|
|
|
|
|
| lignin biosynthesis |
AraCyc |
20 |
0.000 |
2 |
0.031 |
|
|
|
|
|
|
|
|
|
|
|
| Purine metabolism |
KEGG |
20 |
0.000 |
2 |
0.052 |
|
|
|
|
|
|
|
|
|
|
|
| alanine biosynthesis II |
AraCyc |
18 |
0.000 |
3 |
0.001 |
|
|
|
|
|
|
|
|
|
|
|
| phenylalanine biosynthesis II |
AraCyc |
18 |
0.000 |
3 |
0.000 |
|
|
|
|
|
|
|
|
|
|
|
| Ascorbate and aldarate metabolism |
KEGG |
17 |
0.000 |
2 |
0.005 |
|
|
|
|
|
|
|
|
|
|
|
| Fluorene degradation |
KEGG |
17 |
0.000 |
2 |
0.001 |
|
|
|
|
|
|
|
|
|
|
|
| gamma-Hexachlorocyclohexane degradation |
KEGG |
17 |
0.000 |
2 |
0.002 |
|
|
|
|
|
|
|
|
|
|
|
| sulfate assimilation |
TAIR-GO |
16 |
0.000 |
2 |
0.001 |
|
|
|
|
|
|
|
|
|
|
|
| dissimilatory sulfate reduction |
AraCyc |
16 |
0.000 |
2 |
0.000 |
|
|
|
|
|
|
|
|
|
|
|
| metabolism of the cysteine - aromatic group |
FunCat |
16 |
0.000 |
2 |
0.000 |
|
|
|
|
|
|
|
|
|
|
|
| nitrogen and sulfur utilization |
FunCat |
16 |
0.000 |
2 |
0.000 |
|
|
|
|
|
|
|
|
|
|
|
| nucleotide metabolism |
FunCat |
16 |
0.000 |
2 |
0.000 |
|
|
|
|
|
|
|
|
|
|
|
| Cysteine metabolism |
KEGG |
16 |
0.000 |
2 |
0.006 |
|
|
|
|
|
|
|
|
|
|
|
| Glutathione metabolism |
KEGG |
12 |
0.002 |
2 |
0.021 |
|
|
|
|
|
|
|
|
|
|
|
| Phenylalanine metabolism |
KEGG |
12 |
0.011 |
2 |
0.124 |
|
|
|
|
|
|
|
|
|
|
|
|
|
|
|
|
|
|
|
|
|
|
|
|
|
|
|
|
|
|
|
|
|
|
|
|
|
|
|
|
|
|
|
|
|
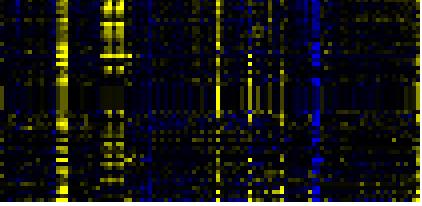
| Pathways co-expressed in the Hormone etc. data set |
|
CYP79B2 (At4g39950) |
|
|
|
|
|
|
|
|
|
|
|
| max. difference between log2-ratios: |
5.06 |
|
|
|
|
|
|
|
|
|
|
|
|
|
|
|
| max. difference between log2-ratios excluding lowest and highest 5%: |
2.51 |
|
|
|
|
|
|
|
|
|
|
|
|
|
|
|
| Pathway |
Source |
Scores of Genes |
p[Score] |
No. of Genes |
p[genes] |
|
|
|
|
|
|
|
|
|
|
|
| Phenylpropanoid Metabolism |
BioPath |
120 |
0.000 |
15 |
0.000 |
Link to hormones etc. heatmap |
|
|
|
|
|
|
|
| Aromatic amino acid (Phe, Tyr, Trp) metabolism |
BioPath |
98 |
0.000 |
12 |
0.000 |
|
|
|
|
|
|
|
| Shikimate pathway |
LitPath |
98 |
0.000 |
12 |
0.000 |
|
|
|
|
|
|
| tryptophan biosynthesis |
TAIR-GO |
88 |
0.000 |
11 |
0.000 |
|
|
|
|
|
|
| Trp biosyntesis |
LitPath |
78 |
0.000 |
10 |
0.000 |
|
|
|
|
|
|
| Phenylalanine, tyrosine and tryptophan biosynthesis |
KEGG |
72 |
0.000 |
8 |
0.000 |
|
|
|
|
|
|
| tryptophan biosynthesis |
AraCyc |
70 |
0.000 |
10 |
0.000 |
|
|
|
|
|
|
| Glucosinolate Metabolism |
LitPath |
70 |
0.000 |
7 |
0.000 |
|
|
|
|
|
|
| response to pathogenic bacteria |
TAIR-GO |
58 |
0.000 |
8 |
0.000 |
|
|
|
|
|
|
| Biosynthesis of Amino Acids and Derivatives |
BioPath |
48 |
0.000 |
6 |
0.028 |
|
|
|
|
|
|
| response to wounding |
TAIR-GO |
46 |
0.000 |
5 |
0.000 |
|
|
|
|
|
|
| Glutathione metabolism |
BioPath |
42 |
0.000 |
5 |
0.001 |
|
|
|
|
|
|
| jasmonic acid biosynthesis |
TAIR-GO |
32 |
0.000 |
4 |
0.001 |
|
|
|
|
|
|
|
|
|
|
|
| jasmonic acid biosynthesis |
AraCyc |
32 |
0.000 |
4 |
0.000 |
|
|
|
|
|
|
|
|
|
|
|
| Lipid signaling |
AcylLipid |
32 |
0.000 |
4 |
0.001 |
|
|
|
|
|
|
|
|
|
|
|
| glucosinolate biosynthesis from tryptophan |
AraCyc |
30 |
0.000 |
3 |
0.000 |
|
|
|
|
|
|
|
|
|
|
|
| amino acid metabolism |
FunCat |
30 |
0.000 |
4 |
0.001 |
|
|
|
|
|
|
|
|
|
|
|
| Sulfur metabolism |
KEGG |
29 |
0.000 |
3 |
0.000 |
|
|
|
|
|
|
|
|
|
|
|
| lipoxygenase pathway |
AraCyc |
22 |
0.000 |
3 |
0.000 |
|
|
|
|
|
|
|
|
|
|
|
| Flavonoid and anthocyanin metabolism |
BioPath |
20 |
0.000 |
2 |
0.076 |
|
|
|
|
|
|
|
|
|
|
|
| aromatic amino acid family biosynthesis |
TAIR-GO |
20 |
0.000 |
2 |
0.015 |
|
|
|
|
|
|
|
|
|
|
|
| aromatic amino acid family biosynthesis, shikimate pathway |
TAIR-GO |
20 |
0.000 |
2 |
0.010 |
|
|
|
|
|
|
|
|
|
|
|
| indoleacetic acid biosynthesis |
TAIR-GO |
20 |
0.000 |
2 |
0.001 |
|
|
|
|
|
|
|
|
|
|
|
| tryptophan catabolism |
TAIR-GO |
20 |
0.000 |
2 |
0.000 |
|
|
|
|
|
|
|
|
|
|
|
| alanine biosynthesis II |
AraCyc |
20 |
0.000 |
2 |
0.004 |
|
|
|
|
|
|
|
|
|
|
|
| glucosinolate biosynthesis from phenylalanine |
AraCyc |
20 |
0.000 |
2 |
0.000 |
|
|
|
|
|
|
|
|
|
|
|
| IAA biosynthesis |
AraCyc |
20 |
0.000 |
2 |
0.000 |
|
|
|
|
|
|
|
|
|
|
|
| IAA biosynthesis I |
AraCyc |
20 |
0.000 |
2 |
0.000 |
|
|
|
|
|
|
|
|
|
|
|
| phenylalanine biosynthesis II |
AraCyc |
20 |
0.000 |
2 |
0.003 |
|
|
|
|
|
|
|
|
|
|
|
| sulfate assimilation III |
AraCyc |
20 |
0.000 |
2 |
0.009 |
|
|
|
|
|
|
|
|
|
|
|
| Purine metabolism |
KEGG |
20 |
0.000 |
2 |
0.015 |
|
|
|
|
|
|
|
|
|
|
|
| Selenoamino acid metabolism |
KEGG |
20 |
0.000 |
2 |
0.002 |
|
|
|
|
|
|
|
|
|
|
|
| stress response |
FunCat |
19 |
0.000 |
3 |
0.000 |
|
|
|
|
|
|
|
|
|
|
|
| growth |
TAIR-GO |
16 |
0.003 |
2 |
0.063 |
|
|
|
|
|
|
|
|
|
|
|
| metabolism of the cysteine - aromatic group |
FunCat |
16 |
0.000 |
2 |
0.000 |
|
|
|
|
|
|
|
|
|
|
|
| nucleotide metabolism |
FunCat |
16 |
0.000 |
2 |
0.000 |
|
|
|
|
|
|
|
|
|
|
|
| defense response |
TAIR-GO |
13 |
0.016 |
2 |
0.040 |
|
|
|
|
|
|
|
|
|
|
|
| protein folding |
TAIR-GO |
12 |
0.000 |
2 |
0.000 |
|
|
|
|
|
|
|
|
|
|
|
| response to heat |
TAIR-GO |
12 |
0.000 |
2 |
0.010 |
|
|
|
|
|
|
|
|
|
|
|
| Protein folding and associated processing |
KEGG |
12 |
0.000 |
2 |
0.001 |
|
|
|
|
|
|
|
|
|
|
|
|
|
|
|
|
|
|
|
|
|
|
|
|
|
|
|
|
|
|
|
|
|
|
|
|
|
|
|
|
|
|
|
|
|
|
|
|
|
|
|
|
|
|
|
|
|
|
|
|
|
|
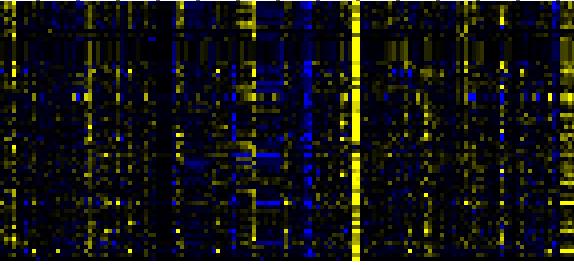
| Pathways co-expressed in the Mutant data set |
|
CYP79B2 (At4g39950) |
|
|
|
|
|
|
|
|
|
|
|
| max. difference between log2-ratios: |
7.88 |
|
|
|
|
|
|
|
|
|
|
|
|
|
|
|
| max. difference between log2-ratios excluding lowest and highest 5%: |
2.95 |
|
|
|
|
|
|
|
|
|
|
|
|
|
|
|
| Pathway |
Source |
Scores of Genes |
p[Score] |
No. of Genes |
p[genes] |
|
|
|
|
|
|
|
|
|
|
|
| Phenylpropanoid Metabolism |
BioPath |
78 |
0.000 |
9 |
0.001 |
Link to mutants heatmap |
|
|
|
|
|
|
|
| tryptophan biosynthesis |
TAIR-GO |
74 |
0.000 |
9 |
0.000 |
|
|
|
|
|
| Biosynthesis of Amino Acids and Derivatives |
BioPath |
68 |
0.000 |
8 |
0.002 |
|
|
|
|
| tryptophan biosynthesis |
AraCyc |
66 |
0.000 |
9 |
0.000 |
|
|
|
|
| Shikimate pathway |
LitPath |
64 |
0.000 |
8 |
0.000 |
|
|
|
|
| Trp biosyntesis |
LitPath |
64 |
0.000 |
8 |
0.000 |
|
|
|
|
| Aromatic amino acid (Phe, Tyr, Trp) metabolism |
BioPath |
58 |
0.000 |
7 |
0.000 |
|
|
|
|
| Glutathione metabolism |
BioPath |
56 |
0.000 |
6 |
0.000 |
|
|
|
|
| Glucosinolate Metabolism |
LitPath |
50 |
0.000 |
5 |
0.000 |
|
|
|
|
| response to pathogenic bacteria |
TAIR-GO |
44 |
0.000 |
6 |
0.000 |
|
|
|
|
| Phenylalanine, tyrosine and tryptophan biosynthesis |
KEGG |
42 |
0.000 |
5 |
0.000 |
|
|
|
|
| response to wounding |
TAIR-GO |
40 |
0.000 |
5 |
0.000 |
|
|
|
|
| Lipid signaling |
AcylLipid |
38 |
0.000 |
7 |
0.001 |
|
|
|
|
| jasmonic acid biosynthesis |
TAIR-GO |
32 |
0.000 |
4 |
0.000 |
|
|
|
|
| jasmonic acid biosynthesis |
AraCyc |
32 |
0.000 |
4 |
0.000 |
|
|
|
|
| glucosinolate biosynthesis from tryptophan |
AraCyc |
30 |
0.000 |
3 |
0.000 |
|
|
|
|
|
|
|
|
|
|
|
| Purine metabolism |
KEGG |
30 |
0.000 |
3 |
0.009 |
|
|
|
|
|
|
|
|
|
|
|
| Selenoamino acid metabolism |
KEGG |
30 |
0.000 |
3 |
0.001 |
|
|
|
|
|
|
|
|
|
|
|
| Sulfur metabolism |
KEGG |
30 |
0.000 |
3 |
0.000 |
|
|
|
|
|
|
|
|
|
|
|
| Phenylpropanoid pathway |
LitPath |
28 |
0.019 |
4 |
0.217 |
|
|
|
|
|
|
|
|
|
|
|
| dissimilatory sulfate reduction |
AraCyc |
26 |
0.000 |
3 |
0.000 |
|
|
|
|
|
|
|
|
|
|
|
| sulfate assimilation III |
AraCyc |
26 |
0.000 |
3 |
0.002 |
|
|
|
|
|
|
|
|
|
|
|
| lipoxygenase pathway |
AraCyc |
22 |
0.000 |
3 |
0.000 |
|
|
|
|
|
|
|
|
|
|
|
| sulfate assimilation |
TAIR-GO |
20 |
0.000 |
2 |
0.001 |
|
|
|
|
|
|
|
|
|
|
|
| tryptophan catabolism |
TAIR-GO |
20 |
0.000 |
2 |
0.000 |
|
|
|
|
|
|
|
|
|
|
|
| glucosinolate biosynthesis from phenylalanine |
AraCyc |
20 |
0.000 |
2 |
0.000 |
|
|
|
|
|
|
|
|
|
|
|
| IAA biosynthesis |
AraCyc |
20 |
0.000 |
2 |
0.001 |
|
|
|
|
|
|
|
|
|
|
|
| IAA biosynthesis I |
AraCyc |
20 |
0.000 |
2 |
0.000 |
|
|
|
|
|
|
|
|
|
|
|
| nitrogen and sulfur utilization |
FunCat |
20 |
0.000 |
2 |
0.000 |
|
|
|
|
|
|
|
|
|
|
|
| lignin biosynthesis |
AraCyc |
18 |
0.000 |
3 |
0.005 |
|
|
|
|
|
|
|
|
|
|
|
| Benzoate degradation via CoA ligation |
KEGG |
15 |
0.000 |
4 |
0.007 |
|
|
|
|
|
|
|
|
|
|
|
| Inositol phosphate metabolism |
KEGG |
15 |
0.001 |
4 |
0.010 |
|
|
|
|
|
|
|
|
|
|
|
| Nicotinate and nicotinamide metabolism |
KEGG |
15 |
0.000 |
4 |
0.005 |
|
|
|
|
|
|
|
|
|
|
|
| amino acid metabolism |
FunCat |
14 |
0.000 |
2 |
0.010 |
|
|
|
|
|
|
|
|
|
|
|
| toxin catabolism |
TAIR-GO |
12 |
0.000 |
2 |
0.095 |
|
|
|
|
|
|
|
|
|
|
|
| flavonoid biosynthesis |
AraCyc |
12 |
0.000 |
2 |
0.008 |
|
|
|
|
|
|
|
|
|
|
|
| Alanine and aspartate metabolism |
KEGG |
12 |
0.000 |
2 |
0.008 |
|
|
|
|
|
|
|
|
|
|
|
| beta-Alanine metabolism |
KEGG |
12 |
0.000 |
2 |
0.002 |
|
|
|
|
|
|
|
|
|
|
|
| Butanoate metabolism |
KEGG |
12 |
0.000 |
2 |
0.004 |
|
|
|
|
|
|
|
|
|
|
|
| Glutamate metabolism |
KEGG |
12 |
0.001 |
2 |
0.020 |
|
|
|
|
|
|
|
|
|
|
|
| Stilbene, coumarine and lignin biosynthesis |
KEGG |
12 |
0.006 |
2 |
0.151 |
|
|
|
|
|
|
|
|
|
|
|
| Taurine and hypotaurine metabolism |
KEGG |
12 |
0.000 |
2 |
0.000 |
|
|
|
|
|
|
|
|
|
|
|
|
|
|
|
|
|
|
|
|
|
|
|
|
|
|
|
|