| _________________________________________ |
|
|
|
|
|
|
|
|
|
|
|
|
|
|
|
|
| Pathways co-expressed in all 4 data sets (with more than 6 annotation points each) |
|
Find below a list of pathways that are co-expressed with the bait. First a list of pathways is given that are co-expressed in all data sets. Lists for each individual dataset are shown underneath. Depending on the number of co-expressed pathways only the top scoring pathways are given; all data can be saved as text using the link above. |
|
|
|
|
|
|
|
| Pathway |
Source |
Sum of scores |
Sum of genes |
|
|
|
|
|
|
|
| Glucosinolate Metabolism |
LitPath |
310 |
31 |
|
|
|
|
|
|
|
| Phenylpropanoid Metabolism |
BioPath |
130 |
15 |
|
|
|
|
|
|
|
| glucosinolate biosynthesis from tryptophan |
AraCyc |
110 |
11 |
|
|
|
|
|
|
|
| Flavonoid and anthocyanin metabolism |
BioPath |
80 |
8 |
|
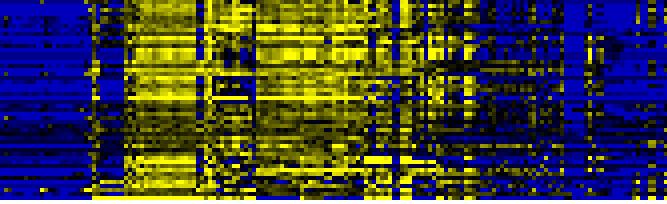
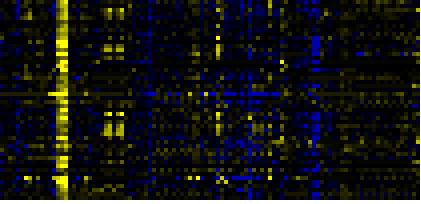
To the right of each table a thumbnail of the actual co-expression heatmap is given. Klick on the link to see the heatmap containing all co-expressed genes. |
|
|
|
|
|
|
|
|
| tryptophan catabolism |
TAIR-GO |
80 |
8 |
|
|
|
|
|
|
|
|
|
| IAA biosynthesis |
AraCyc |
80 |
8 |
|
|
|
|
|
|
|
|
|
| IAA biosynthesis I |
AraCyc |
80 |
8 |
|
For more information on how these pathway maps were generated please read the methods page |
|
|
|
|
|
|
|
|
| jasmonic acid biosynthesis |
TAIR-GO |
64 |
8 |
|
|
|
|
|
|
|
|
|
| jasmonic acid biosynthesis |
AraCyc |
64 |
8 |
|
|
|
|
|
|
|
|
|
|
|
|
|
| Stilbene, coumarine and lignin biosynthesis |
KEGG |
62 |
7 |
|
|
|
|
|
|
|
|
|
|
|
|
|
| indoleacetic acid biosynthesis |
TAIR-GO |
60 |
6 |
|
|
|
|
|
|
|
|
|
|
|
|
|
| tryptophan biosynthesis |
TAIR-GO |
60 |
6 |
|
|
|
|
|
|
|
|
|
|
|
|
|
| gamma-Hexachlorocyclohexane degradation |
KEGG |
54 |
6 |
|
|
|
|
|
|
|
|
|
|
|
|
|
| tryptophan biosynthesis |
AraCyc |
52 |
6 |
|
|
|
|
|
|
|
|
|
|
|
|
|
| Ascorbate and aldarate metabolism |
KEGG |
50 |
5 |
|
|
|
|
|
|
|
|
|
|
|
|
|
| Fluorene degradation |
KEGG |
50 |
5 |
|
|
|
|
|
|
|
|
|
|
|
|
|
|
|
|
|
|
|
|
|
|
|
|
|
|
|
|
|
|
|
|
|
|
|
|
|
|
|
|
|
|
|
|
|
|
|
| Pathways co-expressed in the Organ and Tissue data set (with more than 18 annotation points) |
|
CYP79B3 (At2g22330) |
|
|
|
|
|
|
|
|
| max. difference between log2-ratios: |
5.3 |
|
|
|
|
|
|
|
|
|
|
|
|
| max. difference between log2-ratios excluding lowest and highest 5%: |
3.7 |
|
|
|
|
|
|
|
|
|
|
|
|
| Pathway |
Source |
Scores of Genes |
p[Score] |
No. of Genes |
p[genes] |
Link to organ heatmap |
|
|
|
|
|
|
|
| Glucosinolate Metabolism |
LitPath |
130 |
0.000 |
13 |
0.000 |
|
|
|
| Biosynthesis of Amino Acids and Derivatives |
BioPath |
78 |
0.000 |
11 |
0.000 |
|
|
| Phenylpropanoid Metabolism |
BioPath |
52 |
0.000 |
6 |
0.017 |
|
|
| Glutathione metabolism |
BioPath |
50 |
0.000 |
7 |
0.000 |
|
|
| glucosinolate biosynthesis |
TAIR-GO |
50 |
0.000 |
5 |
0.000 |
|
|
| sulfate assimilation III |
AraCyc |
36 |
0.000 |
4 |
0.000 |
|
|
| Flavonoid and anthocyanin metabolism |
BioPath |
30 |
0.000 |
3 |
0.010 |
|
|
| glucosinolate biosynthesis from homomethionine |
AraCyc |
30 |
0.000 |
3 |
0.000 |
|
|
| glucosinolate biosynthesis from phenylalanine |
AraCyc |
30 |
0.000 |
3 |
0.000 |
|
|
| glucosinolate biosynthesis from tryptophan |
AraCyc |
30 |
0.000 |
3 |
0.000 |
|
|
| Selenoamino acid metabolism |
KEGG |
30 |
0.000 |
3 |
0.000 |
|
|
| Stilbene, coumarine and lignin biosynthesis |
KEGG |
30 |
0.000 |
3 |
0.035 |
|
|
| Sulfur metabolism |
KEGG |
30 |
0.000 |
3 |
0.000 |
|
|
|
|
|
|
|
|
|
|
|
| Branched-chain amino acids from aspartate |
BioPath |
28 |
0.000 |
4 |
0.000 |
|
|
|
|
|
|
|
|
|
|
|
| leucine biosynthesis |
AraCyc |
28 |
0.000 |
4 |
0.000 |
|
|
|
|
|
|
|
|
|
|
|
| amino acid metabolism |
FunCat |
24 |
0.000 |
3 |
0.001 |
|
|
|
|
|
|
|
|
|
|
|
| gamma-Hexachlorocyclohexane degradation |
KEGG |
24 |
0.000 |
3 |
0.000 |
|
|
|
|
|
|
|
|
|
|
|
| Valine, leucine and isoleucine biosynthesis |
KEGG |
24 |
0.000 |
3 |
0.001 |
|
|
|
|
|
|
|
|
|
|
|
| indoleacetic acid biosynthesis |
TAIR-GO |
20 |
0.000 |
2 |
0.000 |
|
|
|
|
|
|
|
|
|
|
|
| tryptophan biosynthesis |
TAIR-GO |
20 |
0.000 |
2 |
0.003 |
|
|
|
|
|
|
|
|
|
|
|
| tryptophan catabolism |
TAIR-GO |
20 |
0.000 |
2 |
0.000 |
|
|
|
|
|
|
|
|
|
|
|
| cysteine biosynthesis I |
AraCyc |
20 |
0.000 |
2 |
0.015 |
|
|
|
|
|
|
|
|
|
|
|
| IAA biosynthesis |
AraCyc |
20 |
0.000 |
2 |
0.000 |
|
|
|
|
|
|
|
|
|
|
|
| IAA biosynthesis I |
AraCyc |
20 |
0.000 |
2 |
0.000 |
|
|
|
|
|
|
|
|
|
|
|
| Ascorbate and aldarate metabolism |
KEGG |
20 |
0.000 |
2 |
0.004 |
|
|
|
|
|
|
|
|
|
|
|
| Fluorene degradation |
KEGG |
20 |
0.000 |
2 |
0.001 |
|
|
|
|
|
|
|
|
|
|
|
| Phenylalanine, tyrosine and tryptophan biosynthesis |
KEGG |
20 |
0.000 |
2 |
0.016 |
|
|
|
|
|
|
|
|
|
|
|
| Purine metabolism |
KEGG |
20 |
0.000 |
2 |
0.039 |
|
|
|
|
|
|
|
|
|
|
|
| Pyruvate metabolism |
KEGG |
20 |
0.000 |
2 |
0.061 |
|
|
|
|
|
|
|
|
|
|
|
|
|
|
|
|
|
|
|
|
|
|
|
|
|
|
|
|
|
|
|
|
|
|
|
|
|
|
|
|
|
|
|
|
|
| Pathways co-expressed in the Stress data set ( with more than 10 annotation points) |
|
CYP79B3 (At2g22330) |
|
|
|
|
|
|
|
|
| max. difference between log2-ratios: |
7.9 |
|
|
|
|
|
|
|
|
|
|
|
|
| max. difference between log2-ratios excluding lowest and highest 5%: |
2.9 |
|
|
|
|
|
|
|
|
|
|
|
|
| Pathway |
Source |
Scores of Genes |
p[Score] |
No. of Genes |
p[genes] |
Link to stress heatmap |
|
|
|
|
|
|
|
| Glucosinolate Metabolism |
LitPath |
70 |
0.000 |
7 |
0.000 |

|
| Biosynthesis of Amino Acids and Derivatives |
BioPath |
66 |
0.000 |
7 |
0.000 |
| Glutathione metabolism |
BioPath |
66 |
0.000 |
7 |
0.000 |
| Sulfur metabolism |
KEGG |
49 |
0.000 |
5 |
0.000 |
| sulfate assimilation III |
AraCyc |
46 |
0.000 |
5 |
0.000 |
| Selenoamino acid metabolism |
KEGG |
40 |
0.000 |
4 |
0.000 |
|
|
|
|
|
|
|
|
|
|
|
| glucosinolate biosynthesis from tryptophan |
AraCyc |
30 |
0.000 |
3 |
0.000 |
|
|
|
|
|
|
|
|
|
|
|
| Flavonoid and anthocyanin metabolism |
BioPath |
20 |
0.000 |
2 |
0.006 |
|
|
|
|
|
|
|
|
|
|
|
| Phenylpropanoid Metabolism |
BioPath |
20 |
0.003 |
2 |
0.107 |
|
|
|
|
|
|
|
|
|
|
|
| indoleacetic acid biosynthesis |
TAIR-GO |
20 |
0.000 |
2 |
0.000 |
|
|
|
|
|
|
|
|
|
|
|
| sulfate reduction |
TAIR-GO |
20 |
0.000 |
2 |
0.000 |
|
|
|
|
|
|
|
|
|
|
|
| tryptophan catabolism |
TAIR-GO |
20 |
0.000 |
2 |
0.000 |
|
|
|
|
|
|
|
|
|
|
|
| cysteine biosynthesis I |
AraCyc |
20 |
0.000 |
2 |
0.002 |
|
|
|
|
|
|
|
|
|
|
|
| glucosinolate biosynthesis from phenylalanine |
AraCyc |
20 |
0.000 |
2 |
0.000 |
|
|
|
|
|
|
|
|
|
|
|
| IAA biosynthesis |
AraCyc |
20 |
0.000 |
2 |
0.000 |
|
|
|
|
|
|
|
|
|
|
|
| IAA biosynthesis I |
AraCyc |
20 |
0.000 |
2 |
0.000 |
|
|
|
|
|
|
|
|
|
|
|
| amino acid metabolism |
FunCat |
20 |
0.000 |
2 |
0.001 |
|
|
|
|
|
|
|
|
|
|
|
| nitrogen and sulfur utilization |
FunCat |
20 |
0.000 |
2 |
0.000 |
|
|
|
|
|
|
|
|
|
|
|
| Purine metabolism |
KEGG |
20 |
0.000 |
2 |
0.006 |
|
|
|
|
|
|
|
|
|
|
|
| dissimilatory sulfate reduction |
AraCyc |
16 |
0.000 |
2 |
0.000 |
|
|
|
|
|
|
|
|
|
|
|
|
|
|
|
|
|
|
|
|
|
|
|
|
|
|
|
|
|
|
|
|
|
|
|
|
|
|
|
|
|
|
|
|
|
| Pathways co-expressed in the Hormone etc. data set (with more than 10 annotation points) |
|
CYP79B3 (At2g22330) |
|
|
|
|
|
|
|
|
| max. difference between log2-ratios: |
5.0 |
|
|
|
|
|
|
|
|
|
|
|
|
| max. difference between log2-ratios excluding lowest and highest 5%: |
2.0 |
|
|
|
|
|
|
|
|
|
|
|
|
| Pathway |
Source |
Scores of Genes |
p[Score] |
No. of Genes |
p[genes] |
Link to hormones etc. heatmap |
|
|
|
|
|
|
|
| Glucosinolate Metabolism |
LitPath |
60 |
0.000 |
6 |
0.000 |
|
|
|
|
|
|
| Biosynthesis of Amino Acids and Derivatives |
BioPath |
58 |
0.000 |
8 |
0.000 |
|
|
|
|
|
| Sulfur metabolism |
KEGG |
55 |
0.000 |
6 |
0.000 |
|
|
|
|
|
| Glutathione metabolism |
BioPath |
48 |
0.000 |
6 |
0.000 |
|
|
|
|
|
| Phenylpropanoid Metabolism |
BioPath |
48 |
0.000 |
6 |
0.003 |
|
|
|
|
|
| Selenoamino acid metabolism |
KEGG |
40 |
0.000 |
4 |
0.000 |
|
|
|
|
|
| Phenylalanine, tyrosine and tryptophan biosynthesis |
KEGG |
30 |
0.000 |
3 |
0.001 |
|
|
|
|
|
| Aromatic amino acid (Phe, Tyr, Trp) metabolism |
BioPath |
26 |
0.000 |
3 |
0.003 |
|
|
|
|
|
| sulfate assimilation III |
AraCyc |
26 |
0.000 |
3 |
0.000 |
|
|
|
|
|
| Purine metabolism |
KEGG |
22 |
0.000 |
3 |
0.003 |
|
|
|
|
|
| Flavonoid and anthocyanin metabolism |
BioPath |
20 |
0.000 |
2 |
0.025 |
|
|
|
|
|
| response to wounding |
TAIR-GO |
20 |
0.000 |
2 |
0.005 |
|
|
|
|
|
| tryptophan catabolism |
TAIR-GO |
20 |
0.000 |
2 |
0.000 |
|
|
|
|
|
| alanine biosynthesis II |
AraCyc |
20 |
0.000 |
2 |
0.003 |
|
|
|
|
|
|
|
|
|
|
|
| glucosinolate biosynthesis from tryptophan |
AraCyc |
20 |
0.000 |
2 |
0.000 |
|
|
|
|
|
|
|
|
|
|
|
| IAA biosynthesis |
AraCyc |
20 |
0.000 |
2 |
0.000 |
|
|
|
|
|
|
|
|
|
|
|
| IAA biosynthesis I |
AraCyc |
20 |
0.000 |
2 |
0.000 |
|
|
|
|
|
|
|
|
|
|
|
| phenylalanine biosynthesis II |
AraCyc |
20 |
0.000 |
2 |
0.002 |
|
|
|
|
|
|
|
|
|
|
|
| amino acid metabolism |
FunCat |
20 |
0.000 |
3 |
0.008 |
|
|
|
|
|
|
|
|
|
|
|
| Shikimate pathway |
LitPath |
20 |
0.000 |
2 |
0.083 |
|
|
|
|
|
|
|
|
|
|
|
| nucleotide metabolism |
FunCat |
18 |
0.000 |
3 |
0.000 |
|
|
|
|
|
|
|
|
|
|
|
| cysteine biosynthesis I |
AraCyc |
16 |
0.000 |
2 |
0.010 |
|
|
|
|
|
|
|
|
|
|
|
| Cysteine metabolism |
KEGG |
16 |
0.000 |
2 |
0.002 |
|
|
|
|
|
|
|
|
|
|
|
| jasmonic acid biosynthesis |
AraCyc |
14 |
0.000 |
2 |
0.001 |
|
|
|
|
|
|
|
|
|
|
|
| lipoxygenase pathway |
AraCyc |
14 |
0.000 |
2 |
0.000 |
|
|
|
|
|
|
|
|
|
|
|
| Lipid signaling |
AcylLipid |
14 |
0.000 |
2 |
0.000 |
|
|
|
|
|
|
|
|
|
|
|
| secondary metabolism |
FunCat |
13 |
0.000 |
3 |
0.001 |
|
|
|
|
|
|
|
|
|
|
|
| phenylalanine degradation I |
AraCyc |
12 |
0.000 |
2 |
0.003 |
|
|
|
|
|
|
|
|
|
|
|
|
|
|
|
|
|
|
|
|
|
|
|
|
|
|
|
|
|
|
|
|
|
|
|
|
|
|
|
|
|
|
|
|
|
|
|
|
|
|
|
|
|
|
|
|
|
|
|
|
|
|
| Pathways co-expressed in the Mutant data set (with more than 10 annotation points) |
|
CYP79B3 (At2g22330) |
|
|
|
|
|
|
|
|
| max. difference between log2-ratios: |
5.9 |
|
|
|
|
|
|
|
|
|
|
|
|
| max. difference between log2-ratios excluding lowest and highest 5%: |
2.0 |
|
|
|
|
|
|
|
|
|
|
|
|
| Pathway |
Source |
Scores of Genes |
p[Score] |
No. of Genes |
p[genes] |
Link to mutants heatmap |
|
|
|
|
|
|
|
| Glucosinolate Metabolism |
LitPath |
50 |
0.000 |
5 |
0.000 |

|
|
|
|
| glucosinolate biosynthesis from tryptophan |
AraCyc |
30 |
0.000 |
3 |
0.000 |
|
|
|
| Cell Wall Carbohydrate Metabolism |
BioPath |
20 |
0.000 |
2 |
0.068 |
|
|
|
| tryptophan catabolism |
TAIR-GO |
20 |
0.000 |
2 |
0.000 |
|
|
|
| IAA biosynthesis |
AraCyc |
20 |
0.000 |
2 |
0.000 |
|
|
|
|
|
|
|
|
|
|
|
| IAA biosynthesis I |
AraCyc |
20 |
0.000 |
2 |
0.000 |
|
|
|
|
|
|
|
|
|
|
|
| Starch and sucrose metabolism |
KEGG |
20 |
0.000 |
2 |
0.002 |
|
|
|
|
|
|
|
|
|
|
|
| jasmonic acid biosynthesis |
AraCyc |
14 |
0.000 |
2 |
0.000 |
|
|
|
|
|
|
|
|
|
|
|
| lipoxygenase pathway |
AraCyc |
14 |
0.000 |
2 |
0.000 |
|
|
|
|
|
|
|
|
|
|
|
| Lipid signaling |
AcylLipid |
14 |
0.000 |
2 |
0.000 |
|
|
|
|
|
|
|
|
|
|
|
| Stilbene, coumarine and lignin biosynthesis |
KEGG |
12 |
0.000 |
2 |
0.004 |
|
|
|
|
|
|
|
|
|
|
|
|
|
|
|
|
|
|
|
|
|
|
|
|
|
|
|
|