|
|
|
|
|
|
|
|
|
|
|
|
|
|
|
|
|
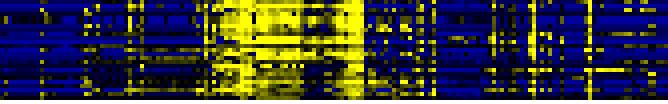
| Pathways co-expressed in the Organ and Tissue data set (with more than 6 annotation points) |
|
CYP81D1 (At5g36220) |
|
|
|
|
|
|
|
|
| max. difference between log2-ratios: |
5.3 |
|
|
|
|
|
|
|
|
|
|
|
|
| max. difference between log2-ratios excluding lowest and highest 5%: |
3.7 |
|
|
|
|
|
|
|
|
|
|
|
|
| Pathway |
Source |
Scores of Genes |
p[Score] |
No. of Genes |
p[genes] |
Link to organ heatmap |
|
|
|
|
|
|
|
| Miscellaneous acyl lipid metabolism |
AcylLipid |
12 |
0.000 |
3 |
0.005 |
|
|
|
| Chloroplastic protein turnover |
BioPath |
10 |
0.000 |
1 |
0.001 |
|
|
| ERD1 protease (ClpC-like) |
BioPath |
10 |
0.000 |
1 |
0.000 |
|
|
| Plastidial Isoprenoids (Chlorophylls, Carotenoids, Tocopherols, Plastoquinone, Phylloquinone) |
BioPath |
10 |
0.000 |
1 |
0.030 |
|
|
| Regulatory enzymes |
BioPath |
10 |
0.000 |
1 |
0.000 |
|
|
| ATP-dependent proteolysis |
TAIR-GO |
10 |
0.000 |
1 |
0.003 |
|
|
| carotenoid biosynthesis |
TAIR-GO |
10 |
0.000 |
1 |
0.001 |
|
|
| plastid organization and biogenesis |
TAIR-GO |
10 |
0.000 |
1 |
0.000 |
|
|
|
|
|
|
|
|
|
|
|
| response to high light intensity |
TAIR-GO |
10 |
0.000 |
1 |
0.000 |
|
|
|
|
|
|
|
|
|
|
|
| response to temperature |
TAIR-GO |
10 |
0.000 |
1 |
0.000 |
|
|
|
|
|
|
|
|
|
|
|
| stress response |
FunCat |
10 |
0.000 |
1 |
0.000 |
|
|
|
|
|
|
|
|
|
|
|
| Accessory protein/regulatory protein |
LitPath |
10 |
0.000 |
1 |
0.000 |
|
|
|
|
|
|
|
|
|
|
|
| cellulose biosynthesis |
BioPath |
8 |
0.000 |
1 |
0.009 |
|
|
|
|
|
|
|
|
|
|
|
| hemicellulose biosynthesis |
BioPath |
8 |
0.000 |
1 |
0.001 |
|
|
|
|
|
|
|
|
|
|
|
| Fructose and mannose metabolism |
KEGG |
8 |
0.000 |
1 |
0.023 |
|
|
|
|
|
|
|
|
|
|
|
| Glycan Biosynthesis and Metabolism |
KEGG |
8 |
0.000 |
1 |
0.041 |
|
|
|
|
|
|
|
|
|
|
|
| Glycerolipid metabolism |
KEGG |
8 |
0.000 |
1 |
0.012 |
|
|
|
|
|
|
|
|
|
|
|
| Ion channels |
KEGG |
8 |
0.000 |
4 |
0.000 |
|
|
|
|
|
|
|
|
|
|
|
| Ligand-Receptor Interaction |
KEGG |
8 |
0.000 |
4 |
0.000 |
|
|
|
|
|
|
|
|
|
|
|
|
|
|
|
|
|
|
|
|
|
|
|
|
|
|
|
|
|
|
|
|
|
|
|
|
|
|
|
|
|
|
|
|
|
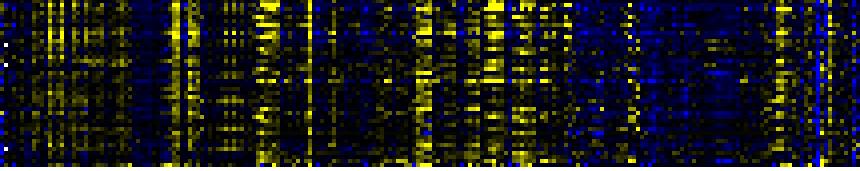
| Pathways co-expressed in the Stress data set ( with more than 20 annotation points) |
|
CYP81D1 (At5g36220) |
|
|
|
|
|
|
|
|
| max. difference between log2-ratios: |
7.9 |
|
|
|
|
|
|
|
|
|
|
|
|
| max. difference between log2-ratios excluding lowest and highest 5%: |
2.4 |
|
|
|
|
|
|
|
|
|
|
|
|
| Pathway |
Source |
Scores of Genes |
p[Score] |
No. of Genes |
p[genes] |
Link to stress heatmap |
|
|
|
|
|
|
|
| response to wounding |
TAIR-GO |
59 |
0.000 |
7 |
0.000 |
|
| Phenylpropanoid Metabolism |
BioPath |
46 |
0.000 |
7 |
0.001 |
| Phenylalanine, tyrosine and tryptophan biosynthesis |
KEGG |
46 |
0.000 |
5 |
0.000 |
| Gluconeogenesis from lipids in seeds |
BioPath |
43 |
0.000 |
5 |
0.000 |
| Lipid signaling |
AcylLipid |
43 |
0.000 |
5 |
0.004 |
| response to jasmonic acid stimulus |
TAIR-GO |
39 |
0.000 |
5 |
0.000 |
| jasmonic acid biosynthesis |
TAIR-GO |
33 |
0.000 |
4 |
0.000 |
| jasmonic acid biosynthesis |
AraCyc |
33 |
0.000 |
4 |
0.000 |
| lipoxygenase pathway |
AraCyc |
33 |
0.000 |
4 |
0.000 |
| Aromatic amino acid (Phe, Tyr, Trp) metabolism |
BioPath |
30 |
0.000 |
3 |
0.004 |
| tryptophan biosynthesis |
TAIR-GO |
30 |
0.000 |
3 |
0.001 |
| tryptophan biosynthesis |
AraCyc |
30 |
0.000 |
3 |
0.001 |
|
|
|
|
|
|
|
|
|
|
|
| Shikimate pathway |
LitPath |
30 |
0.000 |
3 |
0.011 |
|
|
|
|
|
|
|
|
|
|
|
| Trp biosyntesis |
LitPath |
30 |
0.000 |
3 |
0.000 |
|
|
|
|
|
|
|
|
|
|
|
| Fatty acid metabolism |
KEGG |
28 |
0.000 |
3 |
0.002 |
|
|
|
|
|
|
|
|
|
|
|
| Arginine and proline metabolism |
KEGG |
27 |
0.000 |
4 |
0.000 |
|
|
|
|
|
|
|
|
|
|
|
| Degradation of storage lipids and straight fatty acids |
AcylLipid |
27 |
0.000 |
3 |
0.002 |
|
|
|
|
|
|
|
|
|
|
|
| Biosynthesis of Amino Acids and Derivatives |
BioPath |
24 |
0.011 |
4 |
0.052 |
|
|
|
|
|
|
|
|
|
|
|
| amino acid metabolism |
FunCat |
21 |
0.000 |
3 |
0.011 |
|
|
|
|
|
|
|
|
|
|
|
|
|
|
|
|
|
|
|
|
|
|
|
|
|
|
|
|
|
|
|
|
|
|
|
|
|
|
|
|
|
|
|
|
|
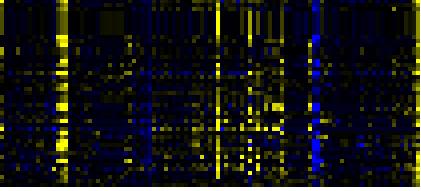
| Pathways co-expressed in the Hormone etc. data set (with more than 10 annotation points) |
|
CYP81D1 (At5g36220) |
|
|
|
|
|
|
|
|
| max. difference between log2-ratios: |
4.7 |
|
|
|
|
|
|
|
|
|
|
|
|
| max. difference between log2-ratios excluding lowest and highest 5%: |
2.1 |
|
|
|
|
|
|
|
|
|
|
|
|
| Pathway |
Source |
Scores of Genes |
p[Score] |
No. of Genes |
p[genes] |
Link to hormones etc. heatmap |
|
|
|
|
|
|
|
| Phenylpropanoid Metabolism |
BioPath |
89 |
0.000 |
15 |
0.000 |
|
|
|
|
|
|
| Shikimate pathway |
LitPath |
88 |
0.000 |
12 |
0.000 |
|
|
|
|
|
| Aromatic amino acid (Phe, Tyr, Trp) metabolism |
BioPath |
82 |
0.000 |
11 |
0.000 |
|
|
|
|
|
| tryptophan biosynthesis |
TAIR-GO |
78 |
0.000 |
10 |
0.000 |
|
|
|
|
|
| Trp biosyntesis |
LitPath |
78 |
0.000 |
10 |
0.000 |
|
|
|
|
|
| tryptophan biosynthesis |
AraCyc |
68 |
0.000 |
9 |
0.000 |
|
|
|
|
|
| response to pathogenic bacteria |
TAIR-GO |
48 |
0.000 |
7 |
0.000 |
|
|
|
|
|
| Phenylalanine, tyrosine and tryptophan biosynthesis |
KEGG |
48 |
0.000 |
6 |
0.000 |
|
|
|
|
|
| amino acid metabolism |
FunCat |
45 |
0.000 |
7 |
0.000 |
|
|
|
|
|
| response to wounding |
TAIR-GO |
42 |
0.000 |
5 |
0.000 |
|
|
|
|
|
| jasmonic acid biosynthesis |
TAIR-GO |
32 |
0.000 |
4 |
0.000 |
|
|
|
|
|
| jasmonic acid biosynthesis |
AraCyc |
32 |
0.000 |
4 |
0.000 |
|
|
|
|
|
| Lipid signaling |
AcylLipid |
32 |
0.000 |
4 |
0.004 |
|
|
|
|
|
|
|
|
|
|
|
| lipoxygenase pathway |
AraCyc |
22 |
0.000 |
3 |
0.000 |
|
|
|
|
|
|
|
|
|
|
|
| Glutathione metabolism |
BioPath |
16 |
0.001 |
2 |
0.122 |
|
|
|
|
|
|
|
|
|
|
|
| response to jasmonic acid stimulus |
TAIR-GO |
16 |
0.000 |
2 |
0.000 |
|
|
|
|
|
|
|
|
|
|
|
| cysteine biosynthesis I |
AraCyc |
16 |
0.000 |
2 |
0.020 |
|
|
|
|
|
|
|
|
|
|
|
| sulfate assimilation III |
AraCyc |
16 |
0.000 |
2 |
0.013 |
|
|
|
|
|
|
|
|
|
|
|
| Miscellaneous acyl lipid metabolism |
AcylLipid |
16 |
0.013 |
2 |
0.200 |
|
|
|
|
|
|
|
|
|
|
|
| defense response |
TAIR-GO |
13 |
0.000 |
2 |
0.011 |
|
|
|
|
|
|
|
|
|
|
|
| arginine degradation V |
AraCyc |
11 |
0.000 |
2 |
0.001 |
|
|
|
|
|
|
|
|
|
|
|
| Arginine and proline metabolism |
KEGG |
11 |
0.000 |
2 |
0.003 |
|
|
|
|
|
|
|
|
|
|
|
| Urea cycle and metabolism of amino groups |
KEGG |
11 |
0.000 |
2 |
0.001 |
|
|
|
|
|
|
|
|
|
|
|
|
|
|
|
|
|
|
|
|
|
|
|
|
|
|
|
|
|
|
|
|
|
|
|
|
|
|
|
|
|
|
|
|
|
|
|
|
|
|
|
|
|
|
|
|
|
|
|
|
|
|
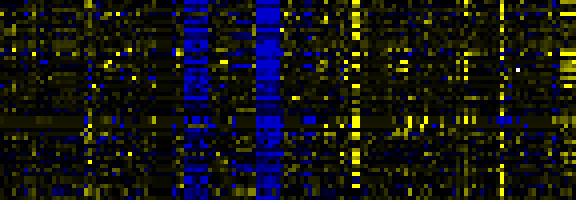
| Pathways co-expressed in the Mutant data set (with more than 20 annotation points) |
|
CYP81D1 (At5g36220) |
|
|
|
|
|
|
|
|
| max. difference between log2-ratios: |
5.8 |
|
|
|
|
|
|
|
|
|
|
|
|
| max. difference between log2-ratios excluding lowest and highest 5%: |
4.2 |
|
|
|
|
|
|
|
|
|
|
|
|
| Pathway |
Source |
Scores of Genes |
p[Score] |
No. of Genes |
p[genes] |
Link to mutants heatmap |
|
|
|
|
|
|
|
| Biosynthesis of Amino Acids and Derivatives |
BioPath |
54 |
0.000 |
7 |
0.019 |
|
|
|
|
| Glutathione metabolism |
BioPath |
48 |
0.000 |
6 |
0.000 |
|
|
|
| Intermediary Carbon Metabolism |
BioPath |
40 |
0.000 |
5 |
0.103 |
|
|
|
| glycolysis and gluconeogenesis |
FunCat |
40 |
0.000 |
5 |
0.006 |
|
|
|
| sulfate assimilation III |
AraCyc |
36 |
0.000 |
4 |
0.000 |
|
|
|
| C-compound and carbohydrate metabolism |
FunCat |
34 |
0.013 |
4 |
0.329 |
|
|
|
| Phenylpropanoid Metabolism |
BioPath |
31 |
0.015 |
7 |
0.023 |
|
|
|
| acetate fermentation |
AraCyc |
30 |
0.000 |
4 |
0.012 |
|
|
|
| fructose degradation (anaerobic) |
AraCyc |
30 |
0.000 |
4 |
0.008 |
|
|
|
| glycerol degradation II |
AraCyc |
30 |
0.000 |
4 |
0.002 |
|
|
|
| glycolysis I |
AraCyc |
30 |
0.000 |
4 |
0.117 |
|
|
|
| glycolysis IV |
AraCyc |
30 |
0.000 |
4 |
0.009 |
|
|
|
| sorbitol fermentation |
AraCyc |
30 |
0.000 |
4 |
0.010 |
|
|
|
|
|
|
|
|
|
|
|
| Glycolysis / Gluconeogenesis |
KEGG |
30 |
0.000 |
4 |
0.005 |
|
|
|
|
|
|
|
|
|
|
|
| Photosystems |
BioPath |
28 |
0.001 |
4 |
0.066 |
|
|
|
|
|
|
|
|
|
|
|
| response to wounding |
TAIR-GO |
26 |
0.000 |
3 |
0.003 |
|
|
|
|
|
|
|
|
|
|
|
| dissimilatory sulfate reduction |
AraCyc |
26 |
0.000 |
3 |
0.000 |
|
|
|
|
|
|
|
|
|
|
|
| gluconeogenesis |
AraCyc |
24 |
0.000 |
3 |
0.012 |
|
|
|
|
|
|
|
|
|
|
|
| glyceraldehyde 3-phosphate degradation |
AraCyc |
24 |
0.000 |
3 |
0.001 |
|
|
|
|
|
|
|
|
|
|
|
| Phenylalanine, tyrosine and tryptophan biosynthesis |
KEGG |
24 |
0.000 |
3 |
0.003 |
|
|
|
|
|
|
|
|
|
|
|
| Gluconeogenesis from lipids in seeds |
BioPath |
22 |
0.000 |
3 |
0.051 |
|
|
|
|
|
|
|
|
|
|
|
|
|
|
|
|
|
|
|
|
|
|
|
|
|
|
|
|