|
|
|
|
|
|
|
|
|
|
|
|
|
|
|
|
|
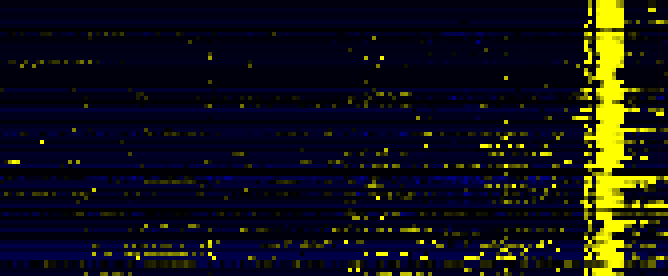
| Pathways co-expressed in the Organ and Tissue data set (with more than 10 annotation points) |
|
CYP81D6 / CYP81D7 (At2g23220 / At2g23190) |
|
|
|
|
|
|
|
|
| max. difference between log2-ratios: |
5.1 |
|
|
|
|
|
|
|
|
|
|
|
|
| max. difference between log2-ratios excluding lowest and highest 5%: |
0.4 |
|
|
|
|
|
|
|
|
|
|
|
|
| Pathway |
Source |
Scores of Genes |
p[Score] |
No. of Genes |
p[genes] |
Link to organ heatmap |
|
|
|
|
|
|
|
| Cell Wall Carbohydrate Metabolism |
BioPath |
30 |
0.000 |
7 |
0.028 |
|
|
|
| secondary metabolism |
FunCat |
24 |
0.000 |
4 |
0.002 |
|
|
| Gibberellin metabolism |
LitPath |
24 |
0.000 |
4 |
0.000 |
|
|
| giberelin biosynthesis |
LitPath |
24 |
0.000 |
4 |
0.000 |
|
|
| Flavonoid and anthocyanin metabolism |
BioPath |
22 |
0.000 |
4 |
0.000 |
|
|
| Phenylpropanoid Metabolism |
BioPath |
22 |
0.000 |
4 |
0.041 |
|
|
| abscisic acid biosynthesis |
TAIR-GO |
12 |
0.000 |
2 |
0.000 |
|
|
| abscisic acid biosynthesis |
AraCyc |
12 |
0.000 |
2 |
0.000 |
|
|
| isoprenoid biosynthesis |
FunCat |
12 |
0.001 |
2 |
0.063 |
|
|
| lipid, fatty acid and isoprenoid biosynthesis |
FunCat |
12 |
0.000 |
2 |
0.045 |
|
|
| Stilbene, coumarine and lignin biosynthesis |
KEGG |
12 |
0.000 |
2 |
0.008 |
|
|
| abscisic acid biosynthesis |
LitPath |
12 |
0.000 |
2 |
0.003 |
|
|
| Carotenoid and abscisic acid metabolism |
LitPath |
12 |
0.002 |
2 |
0.046 |
|
|
| mono-/sesqui-/di-terpene biosynthesis |
LitPath |
12 |
0.005 |
3 |
0.030 |
|
|
| terpenoid metabolism |
LitPath |
12 |
0.005 |
3 |
0.033 |
|
|
|
|
|
|
|
|
|
|
|
|
|
|
|
|
|
|
|
|
|
|
|
|
|
|
|
|
|
|
|
|
|
|
|
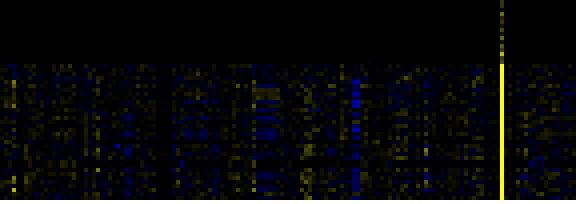
| Pathways co-expressed in the Hormone etc. data set (with more than 15 annotation points) |
|
CYP81D6 / CYP81D7 (At2g23220 / At2g23190) |
|
|
|
|
|
|
|
|
| max. difference between log2-ratios: |
0.4 |
|
|
|
|
|
|
|
|
|
|
|
|
| max. difference between log2-ratios excluding lowest and highest 5%: |
0.0 |
|
|
|
|
|
|
|
|
|
|
|
|
| Pathway |
Source |
Scores of Genes |
p[Score] |
No. of Genes |
p[genes] |
Link to hormones etc. heatmap |
|
|
|
|
|
|
|
| Cell Wall Carbohydrate Metabolism |
BioPath |
132 |
0.000 |
41 |
0.000 |

|
|
|
|
|
|
| pectin metabolism |
BioPath |
72 |
0.000 |
29 |
0.000 |
|
|
|
|
|
| Ribosome |
KEGG |
44 |
0.030 |
8 |
0.416 |
|
|
|
|
|
| mono-/sesqui-/di-terpene biosynthesis |
LitPath |
32 |
0.000 |
5 |
0.006 |
|
|
|
|
|
| terpenoid metabolism |
LitPath |
32 |
0.000 |
5 |
0.007 |
|
|
|
|
|
| Fructose and mannose metabolism |
KEGG |
30 |
0.000 |
5 |
0.003 |
|
|
|
|
|
| Fatty acid elongation and wax and cutin metabolism |
AcylLipid |
27 |
0.000 |
9 |
0.000 |
|
|
|
|
|
| cellulose biosynthesis |
BioPath |
26 |
0.000 |
5 |
0.018 |
|
|
|
|
|
| nucleotide metabolism |
FunCat |
24 |
0.000 |
6 |
0.000 |
|
|
|
|
|
| Miscellaneous acyl lipid metabolism |
AcylLipid |
22 |
0.028 |
9 |
0.160 |
|
|
|
|
|
| (deoxy)ribose phosphate degradation |
AraCyc |
20 |
0.000 |
4 |
0.000 |
|
|
|
|
|
| biosynthesis of derivatives of homoisopentenyl pyrophosphate |
FunCat |
20 |
0.000 |
2 |
0.024 |
|
|
|
|
|
| pyrimidine nucleotide metabolism |
FunCat |
20 |
0.000 |
4 |
0.001 |
|
|
|
|
|
| Glycolysis / Gluconeogenesis |
KEGG |
20 |
0.001 |
5 |
0.035 |
|
|
|
|
|
|
|
|
|
|
|
| Nucleotide Metabolism |
KEGG |
20 |
0.000 |
4 |
0.093 |
|
|
|
|
|
|
|
|
|
|
|
| Pyrimidine metabolism |
KEGG |
20 |
0.000 |
4 |
0.008 |
|
|
|
|
|
|
|
|
|
|
|
| Flavonoid and anthocyanin metabolism |
BioPath |
19 |
0.000 |
5 |
0.044 |
|
|
|
|
|
|
|
|
|
|
|
| biogenesis of cell wall |
FunCat |
18 |
0.002 |
7 |
0.005 |
|
|
|
|
|
|
|
|
|
|
|
| transport |
FunCat |
18 |
0.000 |
5 |
0.000 |
|
|
|
|
|
|
|
|
|
|
|
| Starch and sucrose metabolism |
KEGG |
18 |
0.010 |
6 |
0.009 |
|
|
|
|
|
|
|
|
|
|
|
| hemicellulose biosynthesis |
BioPath |
16 |
0.000 |
2 |
0.037 |
|
|
|
|
|
|
|
|
|
|
|
| acetate fermentation |
AraCyc |
16 |
0.000 |
4 |
0.030 |
|
|
|
|
|
|
|
|
|
|
|
| fructose degradation (anaerobic) |
AraCyc |
16 |
0.000 |
4 |
0.022 |
|
|
|
|
|
|
|
|
|
|
|
| glycerol degradation II |
AraCyc |
16 |
0.000 |
4 |
0.006 |
|
|
|
|
|
|
|
|
|
|
|
| glycolysis IV |
AraCyc |
16 |
0.000 |
4 |
0.024 |
|
|
|
|
|
|
|
|
|
|
|
| non-phosphorylated glucose degradation |
AraCyc |
16 |
0.000 |
4 |
0.001 |
|
|
|
|
|
|
|
|
|
|
|
| sorbitol fermentation |
AraCyc |
16 |
0.000 |
4 |
0.027 |
|
|
|
|
|
|
|
|
|
|
|
| Glycan Biosynthesis and Metabolism |
KEGG |
16 |
0.002 |
2 |
0.325 |
|
|
|
|
|
|
|
|
|
|
|
| Glycerolipid metabolism |
KEGG |
16 |
0.000 |
2 |
0.086 |
|
|
|
|
|
|
|
|
|
|
|
|
|
|
|
|
|
|
|
|
|
|
|
|
|
|
|
|
|
|
|
|
|
|
|
|
|
|
|
|
|
|
|
|
|
|
|
|
|
|
|
|
|
|
|
|
|
|
|
|
|
|
| Pathways co-expressed in the Mutant data set (with more than 10 annotation points) |
|
CYP81D6 / CYP81D7 (At2g23220 / At2g23190) |
|
|
|
|
|
|
|
|
| max. difference between log2-ratios: |
0.1 |
|
|
|
|
|
|
|
|
|
|
|
|
| max. difference between log2-ratios excluding lowest and highest 5%: |
0.0 |
|
|
|
|
|
|
|
|
|
|
|
|
| Pathway |
Source |
Scores of Genes |
p[Score] |
No. of Genes |
p[genes] |
Link to mutants heatmap |
|
|
|
|
|
|
|
| C-compound and carbohydrate metabolism |
FunCat |
240 |
0.016 |
46 |
0.150 |
|
|
|
|
| Plastidial Isoprenoids (Chlorophylls, Carotenoids, Tocopherols, Plastoquinone, Phylloquinone) |
BioPath |
217 |
0.000 |
28 |
0.000 |
|
|
|
| Intermediary Carbon Metabolism |
BioPath |
188 |
0.000 |
34 |
0.023 |
|
|
|
| transport |
FunCat |
154 |
0.000 |
29 |
0.000 |
|
|
|
| Photosystems |
BioPath |
150 |
0.010 |
19 |
0.254 |
|
|
|
| biogenesis of chloroplast |
FunCat |
140 |
0.000 |
21 |
0.000 |
|
|
|
| protein synthesis |
FunCat |
120 |
0.041 |
25 |
0.064 |
|
|
|
| Carbon fixation |
KEGG |
110 |
0.000 |
19 |
0.003 |
|
|
|
| Isoprenoid Biosynthesis in the Cytosol and in Mitochondria |
BioPath |
102 |
0.021 |
12 |
0.206 |
|
|
|
| Pyruvate metabolism |
KEGG |
102 |
0.001 |
16 |
0.078 |
|
|
|
| Chlorophyll biosynthesis and breakdown |
BioPath |
100 |
0.000 |
12 |
0.001 |
|
|
|
| chlorophyll and phytochromobilin metabolism |
LitPath |
100 |
0.000 |
12 |
0.001 |
|
|
|
| Glycolysis / Gluconeogenesis |
KEGG |
97 |
0.005 |
17 |
0.077 |
|
|
|
| Glutathione metabolism |
BioPath |
96 |
0.006 |
14 |
0.134 |
|
|
|
|
|
|
|
|
|
|
|
| transport facilitation |
FunCat |
96 |
0.000 |
17 |
0.000 |
|
|
|
|
|
|
|
|
|
|
|
| Oxidative phosphorylation |
KEGG |
91 |
0.000 |
22 |
0.001 |
|
|
|
|
|
|
|
|
|
|
|
| photosynthesis |
FunCat |
86 |
0.000 |
13 |
0.005 |
|
|
|
|
|
|
|
|
|
|
|
| Biosynthesis of steroids |
KEGG |
85 |
0.006 |
9 |
0.224 |
|
|
|
|
|
|
|
|
|
|
|
| chlorophyll biosynthesis |
AraCyc |
80 |
0.000 |
10 |
0.188 |
|
|
|
|
|
|
|
|
|
|
|
| Sulfur metabolism |
KEGG |
79 |
0.000 |
10 |
0.000 |
|
|
|
|
|
|
|
|
|
|
|
| additional photosystem II components |
BioPath |
72 |
0.001 |
9 |
0.085 |
|
|
|
|
|
|
|
|
|
|
|
| Glutamate metabolism |
KEGG |
71 |
0.004 |
9 |
0.165 |
|
|
|
|
|
|
|
|
|
|
|
|
|
|
|
|
|
|
|
|
|
|
|
|
|
|
|
|