| _________________________________________ |
|
|
|
|
|
|
|
|

|
|
|
|
|
|
|
| Pathways co-expressed in all 4 data sets (with more than 6 annotation points each) |
|
Find below a list of pathways that are co-expressed with the bait. First a list of pathways is given that are co-expressed in all data sets. Lists for each individual dataset are shown underneath. Depending on the number of co-expressed pathways only the top scoring pathways are given; all data can be saved as text using the link above. |
|
|
|
|
|
|
| Pathway |
Source |
Sum of scores |
Sum of genes |
|
|
|
|
|
|
|
| Glutathione metabolism |
KEGG |
102 |
19 |
|
|
|
|
|
|
|
| Glutathione metabolism |
BioPath |
100 |
18 |
|
|
|
|
|
|
|
|
|
| toxin catabolism |
TAIR-GO |
90 |
33 |
|
|
|
|
|
|
|
|
|
| camalexin biosynthesis |
AraCyc |
49 |
7 |
|
To the right of each table a thumbnail of the actual co-expression heatmap is given. Klick on the link to see the heatmap containing all co-expressed genes. |
|
|
|
|
|
|
|
|
| camalexin biosynthesis |
LitPath |
49 |
7 |
|
|
|
|
|
|
|
|
|
| indole phytoalexin biosynthesis |
TAIR-GO |
28 |
4 |
|
|
|
|
|
|
|
|
|
| Fluorene degradation |
KEGG |
28 |
4 |
|
For more information on how these pathway maps were generated please read the methods page |
|
|
|
|
|
|
|
|
| gamma-Hexachlorocyclohexane degradation |
KEGG |
28 |
4 |
|
|
|
|
|
|
|
|
|
|
|
|
|
|
|
|
|
|
|
|
|
|
|
|
|
|
|
|
|
|
|
|
|
|
|
|
|
|
|
|
|
|
|
| Pathways co-expressed in the Organ and Tissue data set (with more than 6 annotation points) |
|
CYP81D8 (At4g37370) |
|
|
|
|
|
|
|
|
| max. difference between log2-ratios: |
6.3 |
|
|
|
|
|
|
|
|
|
|
|
|
| max. difference between log2-ratios excluding lowest and highest 5%: |
4.7 |
|
|
|
|
|
|
|
|
|
|
|
|
| Pathway |
Source |
Scores of Genes |
p[Score] |
No. of Genes |
p[genes] |
Link to organ heatmap |
|
|
|
|
|
|
|
| Stilbene, coumarine and lignin biosynthesis |
KEGG |
17 |
0.000 |
2 |
0.002 |

|
|
|
| toxin catabolism |
TAIR-GO |
14 |
0.000 |
3 |
0.000 |
|
|
| Glutathione metabolism |
KEGG |
12 |
0.000 |
2 |
0.000 |
|
|
| Biosynthesis of Amino Acids and Derivatives |
BioPath |
10 |
0.000 |
1 |
0.004 |
|
|
|
|
|
|
|
|
|
|
|
| Glutathione metabolism |
BioPath |
10 |
0.000 |
1 |
0.001 |
|
|
|
|
|
|
|
|
|
|
|
| indole phytoalexin biosynthesis |
TAIR-GO |
7 |
0.000 |
1 |
0.000 |
|
|
|
|
|
|
|
|
|
|
|
| camalexin biosynthesis |
AraCyc |
7 |
0.000 |
1 |
0.000 |
|
|
|
|
|
|
|
|
|
|
|
| Ascorbate and aldarate metabolism |
KEGG |
7 |
0.000 |
1 |
0.002 |
|
|
|
|
|
|
|
|
|
|
|
| Fluorene degradation |
KEGG |
7 |
0.000 |
1 |
0.001 |
|
|
|
|
|
|
|
|
|
|
|
| gamma-Hexachlorocyclohexane degradation |
KEGG |
7 |
0.000 |
1 |
0.001 |
|
|
|
|
|
|
|
|
|
|
|
| camalexin biosynthesis |
LitPath |
7 |
0.000 |
1 |
0.000 |
|
|
|
|
|
|
|
|
|
|
|
|
|
|
|
|
|
|
|
|
|
|
|
|
|
|
|
|
|
|
|
|
|
|
|
|
|
|
|
|
|
|
|
|
|
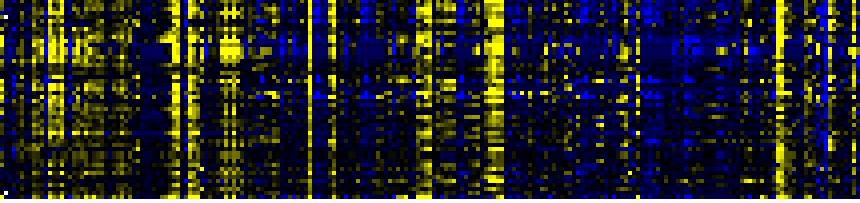
| Pathways co-expressed in the Stress data set ( with more than 20 annotation points) |
|
CYP81D8 (At4g37370) |
|
|
|
|
|
|
|
|
| max. difference between log2-ratios: |
9.6 |
|
|
|
|
|
|
|
|
|
|
|
|
| max. difference between log2-ratios excluding lowest and highest 5%: |
5.1 |
|
|
|
|
|
|
|
|
|
|
|
|
| Pathway |
Source |
Scores of Genes |
p[Score] |
No. of Genes |
p[genes] |
Link to stress heatmap |
|
|
|
|
|
|
|
| Phenylpropanoid Metabolism |
BioPath |
112 |
0.000 |
17 |
0.000 |
|
| Aromatic amino acid (Phe, Tyr, Trp) metabolism |
BioPath |
66 |
0.000 |
9 |
0.000 |
| Shikimate pathway |
LitPath |
62 |
0.000 |
9 |
0.000 |
| response to pathogenic bacteria |
TAIR-GO |
58 |
0.000 |
8 |
0.000 |
| tryptophan biosynthesis |
TAIR-GO |
58 |
0.000 |
8 |
0.000 |
| tryptophan biosynthesis |
AraCyc |
58 |
0.000 |
8 |
0.000 |
| Trp biosyntesis |
LitPath |
58 |
0.000 |
8 |
0.000 |
| Phenylalanine, tyrosine and tryptophan biosynthesis |
KEGG |
48 |
0.000 |
6 |
0.000 |
| Gluconeogenesis from lipids in seeds |
BioPath |
40 |
0.000 |
4 |
0.027 |
| lipid, fatty acid and isoprenoid degradation |
FunCat |
36 |
0.000 |
5 |
0.000 |
| toxin catabolism |
TAIR-GO |
34 |
0.000 |
13 |
0.000 |
| Degradation of storage lipids and straight fatty acids |
AcylLipid |
32 |
0.000 |
4 |
0.006 |
| Phenylpropanoid pathway |
LitPath |
32 |
0.005 |
6 |
0.088 |
|
|
|
|
|
|
|
|
|
|
|
| Glucosyltransferases for benzoic acids |
BioPath |
30 |
0.000 |
3 |
0.000 |
|
|
|
|
|
|
|
|
|
|
|
| Fatty acid metabolism |
KEGG |
30 |
0.000 |
3 |
0.009 |
|
|
|
|
|
|
|
|
|
|
|
| Lipid signaling |
AcylLipid |
30 |
0.001 |
7 |
0.037 |
|
|
|
|
|
|
|
|
|
|
|
| Cysteine metabolism |
KEGG |
24 |
0.000 |
3 |
0.004 |
|
|
|
|
|
|
|
|
|
|
|
| Glutathione metabolism |
BioPath |
22 |
0.003 |
3 |
0.095 |
|
|
|
|
|
|
|
|
|
|
|
| Alanine and aspartate metabolism |
KEGG |
22 |
0.000 |
3 |
0.006 |
|
|
|
|
|
|
|
|
|
|
|
| Glutamate metabolism |
KEGG |
22 |
0.000 |
3 |
0.020 |
|
|
|
|
|
|
|
|
|
|
|
| defense response |
TAIR-GO |
21 |
0.000 |
3 |
0.008 |
|
|
|
|
|
|
|
|
|
|
|
|
|
|
|
|
|
|
|
|
|
|
|
|
|
|
|
|
|
|
|
|
|
|
|
|
|
|
|
|
|
|
|
|
|
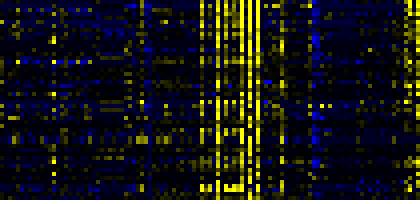
| Pathways co-expressed in the Hormone etc. data set (with more than 20 annotation points) |
|
CYP81D8 (At4g37370) |
|
|
|
|
|
|
|
|
| max. difference between log2-ratios: |
9.0 |
|
|
|
|
|
|
|
|
|
|
|
|
| max. difference between log2-ratios excluding lowest and highest 5%: |
3.1 |
|
|
|
|
|
|
|
|
|
|
|
|
| Pathway |
Source |
Scores of Genes |
p[Score] |
No. of Genes |
p[genes] |
Link to hormones etc. heatmap |
|
|
|
|
|
|
|
| Phenylpropanoid Metabolism |
BioPath |
93 |
0.000 |
14 |
0.000 |
|
|
|
|
|
|
| Lipid signaling |
AcylLipid |
50 |
0.000 |
13 |
0.002 |
|
|
|
|
|
| response to pathogenic bacteria |
TAIR-GO |
48 |
0.000 |
7 |
0.000 |
|
|
|
|
|
| Phenylpropanoid pathway |
LitPath |
44 |
0.000 |
7 |
0.016 |
|
|
|
|
|
| Biosynthesis of Amino Acids and Derivatives |
BioPath |
42 |
0.006 |
6 |
0.145 |
|
|
|
|
|
| Shikimate pathway |
LitPath |
42 |
0.000 |
7 |
0.000 |
|
|
|
|
|
| tryptophan biosynthesis |
TAIR-GO |
38 |
0.000 |
6 |
0.000 |
|
|
|
|
|
| tryptophan biosynthesis |
AraCyc |
38 |
0.000 |
6 |
0.000 |
|
|
|
|
|
| Trp biosyntesis |
LitPath |
38 |
0.000 |
6 |
0.000 |
|
|
|
|
|
| Aromatic amino acid (Phe, Tyr, Trp) metabolism |
BioPath |
36 |
0.000 |
6 |
0.000 |
|
|
|
|
|
| Glucosyltransferases for benzoic acids |
BioPath |
30 |
0.000 |
3 |
0.000 |
|
|
|
|
|
| lignin biosynthesis |
AraCyc |
30 |
0.000 |
5 |
0.001 |
|
|
|
|
|
| Benzoate degradation via CoA ligation |
KEGG |
29 |
0.000 |
10 |
0.000 |
|
|
|
|
|
|
|
|
|
|
|
| core phenylpropanoid metabolism |
BioPath |
26 |
0.000 |
4 |
0.006 |
|
|
|
|
|
|
|
|
|
|
|
| biosynthesis of proto- and siroheme |
AraCyc |
26 |
0.000 |
4 |
0.005 |
|
|
|
|
|
|
|
|
|
|
|
| Miscellaneous acyl lipid metabolism |
AcylLipid |
26 |
0.041 |
7 |
0.446 |
|
|
|
|
|
|
|
|
|
|
|
| triacylglycerol degradation |
AraCyc |
25 |
0.000 |
6 |
0.001 |
|
|
|
|
|
|
|
|
|
|
|
| jasmonic acid biosynthesis |
TAIR-GO |
24 |
0.000 |
4 |
0.001 |
|
|
|
|
|
|
|
|
|
|
|
| jasmonic acid biosynthesis |
AraCyc |
24 |
0.000 |
4 |
0.000 |
|
|
|
|
|
|
|
|
|
|
|
| Ion channels |
KEGG |
24 |
0.000 |
11 |
0.000 |
|
|
|
|
|
|
|
|
|
|
|
| Ligand-Receptor Interaction |
KEGG |
24 |
0.000 |
11 |
0.000 |
|
|
|
|
|
|
|
|
|
|
|
| ethylene biosynthesis |
TAIR-GO |
23 |
0.000 |
3 |
0.000 |
|
|
|
|
|
|
|
|
|
|
|
| Glutathione metabolism |
BioPath |
22 |
0.002 |
3 |
0.107 |
|
|
|
|
|
|
|
|
|
|
|
| toxin catabolism |
TAIR-GO |
22 |
0.000 |
11 |
0.000 |
|
|
|
|
|
|
|
|
|
|
|
|
|
|
|
|
|
|
|
|
|
|
|
|
|
|
|
|
|
|
|
|
|
|
|
|
|
|
|
|
|
|
|
|
|
|
|
|
|
|
|
|
|
|
|
|
|
|
|
|
|
|
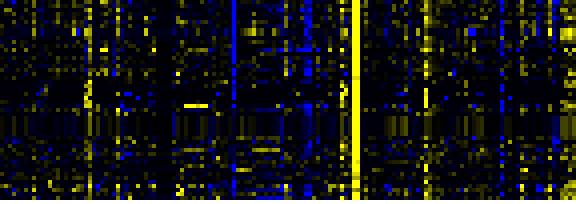
| Pathways co-expressed in the Mutant data set (with more than 15 annotation points) |
|
CYP81D8 (At4g37370) |
|
|
|
|
|
|
|
|
| max. difference between log2-ratios: |
9.5 |
|
|
|
|
|
|
|
|
|
|
|
|
| max. difference between log2-ratios excluding lowest and highest 5%: |
3.9 |
|
|
|
|
|
|
|
|
|
|
|
|
| Pathway |
Source |
Scores of Genes |
p[Score] |
No. of Genes |
p[genes] |
Link to mutants heatmap |
|
|
|
|
|
|
|
| response to pathogenic bacteria |
TAIR-GO |
56.5 |
0.000 |
8 |
0.000 |
|
|
|
|
| Phenylpropanoid Metabolism |
BioPath |
50 |
0.000 |
7 |
0.008 |
|
|
|
| tryptophan biosynthesis |
TAIR-GO |
44 |
0.000 |
6 |
0.000 |
|
|
|
| tryptophan biosynthesis |
AraCyc |
44 |
0.000 |
6 |
0.000 |
|
|
|
| Lipid signaling |
AcylLipid |
44 |
0.000 |
11 |
0.006 |
|
|
|
| Shikimate pathway |
LitPath |
44 |
0.000 |
6 |
0.000 |
|
|
|
| Trp biosyntesis |
LitPath |
44 |
0.000 |
6 |
0.000 |
|
|
|
| Aromatic amino acid (Phe, Tyr, Trp) metabolism |
BioPath |
38 |
0.000 |
5 |
0.000 |
|
|
|
| Biosynthesis of Amino Acids and Derivatives |
BioPath |
34 |
0.000 |
6 |
0.022 |
|
|
|
| defense response |
TAIR-GO |
33.5 |
0.000 |
6 |
0.000 |
|
|
|
| triacylglycerol degradation |
AraCyc |
25.5 |
0.000 |
6 |
0.000 |
|
|
|
| response to wounding |
TAIR-GO |
24 |
0.000 |
4 |
0.000 |
|
|
|
| Phenylalanine, tyrosine and tryptophan biosynthesis |
KEGG |
22 |
0.000 |
3 |
0.013 |
|
|
|
|
|
|
|
|
|
|
|
| Methionin/SAM/ethylene metabolism from cysteine and aspartate |
BioPath |
20 |
0.000 |
3 |
0.002 |
|
|
|
|
|
|
|
|
|
|
|
| toxin catabolism |
TAIR-GO |
20 |
0.000 |
6 |
0.000 |
|
|
|
|
|
|
|
|
|
|
|
| gibberellic acid catabolism |
TAIR-GO |
19 |
0.000 |
2 |
0.000 |
|
|
|
|
|
|
|
|
|
|
|
| C-compound and carbohydrate metabolism |
FunCat |
19 |
0.008 |
5 |
0.096 |
|
|
|
|
|
|
|
|
|
|
|
| Benzoate degradation via CoA ligation |
KEGG |
18 |
0.000 |
8 |
0.000 |
|
|
|
|
|
|
|
|
|
|
|
| Inositol phosphate metabolism |
KEGG |
18 |
0.000 |
8 |
0.000 |
|
|
|
|
|
|
|
|
|
|
|
| Nicotinate and nicotinamide metabolism |
KEGG |
18 |
0.000 |
8 |
0.000 |
|
|
|
|
|
|
|
|
|
|
|
| Propanoate metabolism |
KEGG |
18 |
0.000 |
3 |
0.004 |
|
|
|
|
|
|
|
|
|
|
|
| jasmonic acid biosynthesis |
TAIR-GO |
16 |
0.000 |
3 |
0.002 |
|
|
|
|
|
|
|
|
|
|
|
| jasmonic acid biosynthesis |
AraCyc |
16 |
0.000 |
3 |
0.000 |
|
|
|
|
|
|
|
|
|
|
|
| lignin biosynthesis |
AraCyc |
16 |
0.000 |
2 |
0.021 |
|
|
|
|
|
|
|
|
|
|
|
| lipoxygenase pathway |
AraCyc |
16 |
0.000 |
3 |
0.000 |
|
|
|
|
|
|
|
|
|
|
|
|
|
|
|
|
|
|
|
|
|
|
|
|
|
|
|
|