|
|
|
|
|
|
|
|
|
|
|
|
|
|
|
|
|
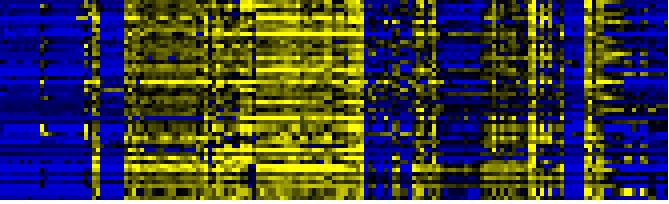
| Pathways co-expressed in the Organ and Tissue data set (with more than 19 annotation points) |
|
CYP81H1 (At4g37310) |
|
|
|
|
|
|
|
|
| max. difference between log2-ratios: |
5.3 |
|
|
|
|
|
|
|
|
|
|
|
|
| max. difference between log2-ratios excluding lowest and highest 5%: |
4.0 |
|
|
|
|
|
|
|
|
|
|
|
|
| Pathway |
Source |
Scores of Genes |
p[Score] |
No. of Genes |
p[genes] |
Link to organ heatmap |
|
|
|
|
|
|
|
| Photosystems |
BioPath |
121 |
0.000 |
17 |
0.000 |
|
|
|
| Photosynthesis |
KEGG |
59 |
0.000 |
9 |
0.000 |
|
|
| Photosystem I |
BioPath |
57 |
0.000 |
9 |
0.000 |
|
|
| Plastidial Isoprenoids (Chlorophylls, Carotenoids, Tocopherols, Plastoquinone, Phylloquinone) |
BioPath |
48 |
0.000 |
7 |
0.014 |
|
|
| photosynthesis |
FunCat |
47 |
0.000 |
8 |
0.000 |
|
|
| photosystem I |
TAIR-GO |
45 |
0.000 |
5 |
0.000 |
|
|
| Carotenoid and abscisic acid metabolism |
LitPath |
44 |
0.000 |
6 |
0.000 |
|
|
| biogenesis of chloroplast |
FunCat |
42 |
0.000 |
7 |
0.000 |
|
|
| transport |
FunCat |
41 |
0.000 |
5 |
0.000 |
|
|
| photosystem II |
TAIR-GO |
37 |
0.000 |
4 |
0.000 |
|
|
| Carotenoid biosynthesis |
BioPath |
34 |
0.000 |
4 |
0.000 |
|
|
| Chlorophyll a/b binding proteins |
BioPath |
34 |
0.000 |
4 |
0.001 |
|
|
| carotenoid biosynthesis |
AraCyc |
34 |
0.000 |
4 |
0.000 |
|
|
|
|
|
|
|
|
|
|
|
| carotenid biosynthesis |
LitPath |
34 |
0.000 |
4 |
0.000 |
|
|
|
|
|
|
|
|
|
|
|
| additional photosystem II components |
BioPath |
32 |
0.000 |
4 |
0.016 |
|
|
|
|
|
|
|
|
|
|
|
| Biosynthesis of steroids |
KEGG |
32 |
0.000 |
4 |
0.000 |
|
|
|
|
|
|
|
|
|
|
|
| Photosystem II |
BioPath |
31 |
0.000 |
4 |
0.016 |
|
|
|
|
|
|
|
|
|
|
|
| Ascorbate and aldarate metabolism |
KEGG |
29 |
0.000 |
3 |
0.000 |
|
|
|
|
|
|
|
|
|
|
|
| Fluorene degradation |
KEGG |
29 |
0.000 |
3 |
0.000 |
|
|
|
|
|
|
|
|
|
|
|
| gamma-Hexachlorocyclohexane degradation |
KEGG |
29 |
0.000 |
3 |
0.000 |
|
|
|
|
|
|
|
|
|
|
|
| Stilbene, coumarine and lignin biosynthesis |
KEGG |
29 |
0.000 |
3 |
0.050 |
|
|
|
|
|
|
|
|
|
|
|
| Carbon fixation |
KEGG |
25 |
0.000 |
3 |
0.013 |
|
|
|
|
|
|
|
|
|
|
|
| photorespiration |
TAIR-GO |
22 |
0.000 |
3 |
0.000 |
|
|
|
|
|
|
|
|
|
|
|
| respiration |
FunCat |
22 |
0.000 |
3 |
0.000 |
|
|
|
|
|
|
|
|
|
|
|
| Fatty acid elongation and wax and cutin metabolism |
AcylLipid |
21 |
0.000 |
3 |
0.028 |
|
|
|
|
|
|
|
|
|
|
|
| Glucosyltransferases for benzoic acids |
BioPath |
20 |
0.000 |
2 |
0.012 |
|
|
|
|
|
|
|
|
|
|
|
| cytochrome b6f complex |
TAIR-GO |
20 |
0.000 |
2 |
0.001 |
|
|
|
|
|
|
|
|
|
|
|
| biosynthesis of phenylpropanoids |
FunCat |
20 |
0.000 |
2 |
0.057 |
|
|
|
|
|
|
|
|
|
|
|
| biosynthesis of secondary products derived from L-phenylalanine and L-tyrosine |
FunCat |
20 |
0.000 |
2 |
0.057 |
|
|
|
|
|
|
|
|
|
|
|
| energy |
FunCat |
20 |
0.000 |
3 |
0.000 |
|
|
|
|
|
|
|
|
|
|
|
| Glucosinolate Metabolism |
LitPath |
20 |
0.000 |
2 |
0.023 |
|
|
|
|
|
|
|
|
|
|
|
|
|
|
|
|
|
|
|
|
|
|
|
|
|
|
|
|
|
|
|
|
|
|
|
|
|
|
|
|
|
|
|
|
|
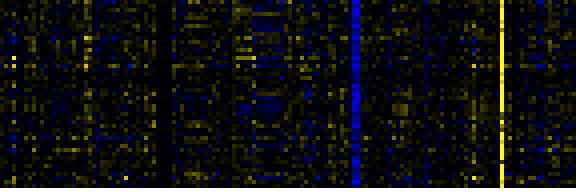
| Pathways co-expressed in the Stress data set ( with more than 6 annotation points) |
|
CYP81H1 (At4g37310) |
|
|
|
|
|
|
|
|
| max. difference between log2-ratios: |
6.8 |
|
|
|
|
|
|
|
|
|
|
|
|
| max. difference between log2-ratios excluding lowest and highest 5%: |
2.5 |
|
|
|
|
|
|
|
|
|
|
|
|
| Pathway |
Source |
Scores of Genes |
p[Score] |
No. of Genes |
p[genes] |
Link to stress heatmap |
|
|
|
|
|
|
|
| indoleacetic acid biosynthesis |
TAIR-GO |
18 |
0.000 |
2 |
0.000 |

|
| IAA biosynthesis |
AraCyc |
18 |
0.000 |
2 |
0.000 |
| IAA biosynthesis I |
AraCyc |
18 |
0.000 |
2 |
0.000 |
| plant / fungal specific systemic sensing and response |
FunCat |
18 |
0.000 |
2 |
0.000 |
|
|
|
|
|
|
|
|
|
|
|
| plant hormonal regulation |
FunCat |
18 |
0.000 |
2 |
0.000 |
|
|
|
|
|
|
|
|
|
|
|
| response to pathogenic bacteria |
TAIR-GO |
9 |
0.000 |
1 |
0.000 |
|
|
|
|
|
|
|
|
|
|
|
| Benzoate degradation via CoA ligation |
KEGG |
9 |
0.000 |
1 |
0.021 |
|
|
|
|
|
|
|
|
|
|
|
| Cyanoamino acid metabolism |
KEGG |
9 |
0.000 |
1 |
0.002 |
|
|
|
|
|
|
|
|
|
|
|
| Nitrogen metabolism |
KEGG |
9 |
0.000 |
1 |
0.003 |
|
|
|
|
|
|
|
|
|
|
|
| Tryptophan metabolism |
KEGG |
9 |
0.000 |
1 |
0.003 |
|
|
|
|
|
|
|
|
|
|
|
|
|
|
|
|
|
|
|
|
|
|
|
|
|
|
|
|
|
|
|
|
|
|
|
|
|
|
|
|
|
|
|
|
|
| Pathways co-expressed in the Hormone etc. data set (with more than 6 annotation points) |
|
CYP81H1 (At4g37310) |
|
|
|
|
|
|
|
|
| max. difference between log2-ratios: |
3.4 |
|
|
|
|
|
|
|
|
|
|
|
|
| max. difference between log2-ratios excluding lowest and highest 5%: |
1.9 |
|
|
|
|
|
|
|
|
|
|
|
|
| Pathway |
Source |
Scores of Genes |
p[Score] |
No. of Genes |
p[genes] |
Link to hormones etc. heatmap |
|
|
|
|
|
|
|
| Gluconeogenesis from lipids in seeds |
BioPath |
12 |
0.000 |
2 |
0.001 |

|
|
|
|
|
|
| phenylalanine degradation I |
AraCyc |
12 |
0.000 |
2 |
0.000 |
|
|
|
|
|
| tyrosine degradation |
AraCyc |
12 |
0.000 |
2 |
0.000 |
|
|
|
|
|
| Phenylalanine metabolism |
KEGG |
12 |
0.000 |
2 |
0.003 |
|
|
|
|
|
| Tyrosine metabolism |
KEGG |
12 |
0.000 |
2 |
0.000 |
|
|
|
|
|
|
|
|
|
|
|
| Plastidial Isoprenoids (Chlorophylls, Carotenoids, Tocopherols, Plastoquinone, Phylloquinone) |
BioPath |
10 |
0.000 |
1 |
0.024 |
|
|
|
|
|
|
|
|
|
|
|
| Tocopherol biosynthesis |
BioPath |
10 |
0.000 |
1 |
0.000 |
|
|
|
|
|
|
|
|
|
|
|
| carotenoid biosynthesis |
TAIR-GO |
10 |
0.000 |
1 |
0.000 |
|
|
|
|
|
|
|
|
|
|
|
| plastoquinone biosynthesis |
TAIR-GO |
10 |
0.000 |
1 |
0.000 |
|
|
|
|
|
|
|
|
|
|
|
| vitamin E biosynthesis |
TAIR-GO |
10 |
0.000 |
1 |
0.000 |
|
|
|
|
|
|
|
|
|
|
|
| fatty acid oxidation pathway |
AraCyc |
10 |
0.000 |
1 |
0.003 |
|
|
|
|
|
|
|
|
|
|
|
| octane oxidation |
AraCyc |
10 |
0.000 |
1 |
0.001 |
|
|
|
|
|
|
|
|
|
|
|
| plastoquinone biosynthesis |
AraCyc |
10 |
0.000 |
1 |
0.000 |
|
|
|
|
|
|
|
|
|
|
|
| vitamin E biosynthesis |
AraCyc |
10 |
0.000 |
1 |
0.000 |
|
|
|
|
|
|
|
|
|
|
|
| Fatty acid metabolism |
KEGG |
10 |
0.000 |
1 |
0.005 |
|
|
|
|
|
|
|
|
|
|
|
| Miscellaneous acyl lipid metabolism |
AcylLipid |
10 |
0.000 |
1 |
0.000 |
|
|
|
|
|
|
|
|
|
|
|
| Nucleotide Metabolism |
KEGG |
9 |
0.000 |
1 |
0.026 |
|
|
|
|
|
|
|
|
|
|
|
| Pyrimidine metabolism |
KEGG |
9 |
0.000 |
1 |
0.007 |
|
|
|
|
|
|
|
|
|
|
|
|
|
|
|
|
|
|
|
|
|
|
|
|
|
|
|
|
|
|
|
|
|
|
|
|
|
|
|
|
|
|
|
|
|
|
|
|
|
|
|
|
|
|
|
|
|
|
|
|
|
|
| Pathways co-expressed in the Mutant data set (with more than 10 annotation points) |
|
CYP81H1 (At4g37310) |
|
|
|
|
|
|
|
|
| max. difference between log2-ratios: |
5.4 |
|
|
|
|
|
|
|
|
|
|
|
|
| max. difference between log2-ratios excluding lowest and highest 5%: |
2.0 |
|
|
|
|
|
|
|
|
|
|
|
|
| Pathway |
Source |
Scores of Genes |
p[Score] |
No. of Genes |
p[genes] |
Link to mutants heatmap |
|
|
|
|
|
|
|
| Fatty acid metabolism |
KEGG |
33 |
0.000 |
4 |
0.000 |
|
|
|
|
| fatty acid beta oxidation complex |
BioPath |
29 |
0.000 |
3 |
0.000 |
|
|
|
| Gluconeogenesis from lipids in seeds |
BioPath |
29 |
0.000 |
3 |
0.004 |
|
|
|
| leucine degradation I |
AraCyc |
29 |
0.000 |
3 |
0.000 |
|
|
|
| leucine degradation II |
AraCyc |
29 |
0.000 |
3 |
0.000 |
|
|
|
| Degradation of storage lipids and straight fatty acids |
AcylLipid |
29 |
0.000 |
3 |
0.000 |
|
|
|
| Tryptophan metabolism |
KEGG |
25 |
0.000 |
4 |
0.000 |
|
|
|
| Valine, leucine and isoleucine degradation |
KEGG |
24 |
0.000 |
3 |
0.004 |
|
|
|
| Bile acid biosynthesis |
KEGG |
23 |
0.000 |
3 |
0.000 |
|
|
|
| Benzoate degradation via CoA ligation |
KEGG |
21 |
0.000 |
3 |
0.081 |
|
|
|
| fatty acid beta-oxidation |
TAIR-GO |
20 |
0.000 |
2 |
0.000 |
|
|
|
| development |
TAIR-GO |
19 |
0.000 |
2 |
0.014 |
|
|
|
| fatty acid oxidation pathway |
AraCyc |
19 |
0.000 |
2 |
0.000 |
|
|
|
|
|
|
|
|
|
|
|
| isoleucine degradation I |
AraCyc |
19 |
0.000 |
2 |
0.001 |
|
|
|
|
|
|
|
|
|
|
|
| isoleucine degradation III |
AraCyc |
19 |
0.000 |
2 |
0.000 |
|
|
|
|
|
|
|
|
|
|
|
| indoleacetic acid biosynthesis |
TAIR-GO |
18 |
0.000 |
2 |
0.000 |
|
|
|
|
|
|
|
|
|
|
|
| IAA biosynthesis |
AraCyc |
18 |
0.000 |
2 |
0.000 |
|
|
|
|
|
|
|
|
|
|
|
| IAA biosynthesis I |
AraCyc |
18 |
0.000 |
2 |
0.000 |
|
|
|
|
|
|
|
|
|
|
|
| C-compound and carbohydrate metabolism |
FunCat |
18 |
0.019 |
4 |
0.081 |
|
|
|
|
|
|
|
|
|
|
|
| plant / fungal specific systemic sensing and response |
FunCat |
18 |
0.000 |
2 |
0.001 |
|
|
|
|
|
|
|
|
|
|
|
| plant hormonal regulation |
FunCat |
18 |
0.000 |
2 |
0.001 |
|
|
|
|
|
|
|
|
|
|
|
| Glycerolipid metabolism |
KEGG |
17 |
0.000 |
3 |
0.003 |
|
|
|
|
|
|
|
|
|
|
|
| Pyruvate metabolism |
KEGG |
17 |
0.003 |
3 |
0.043 |
|
|
|
|
|
|
|
|
|
|
|
| beta-Alanine metabolism |
KEGG |
15 |
0.000 |
3 |
0.000 |
|
|
|
|
|
|
|
|
|
|
|
| Lysine degradation |
KEGG |
15 |
0.000 |
3 |
0.001 |
|
|
|
|
|
|
|
|
|
|
|
| ATP-dependent proteolysis |
TAIR-GO |
12 |
0.000 |
3 |
0.000 |
|
|
|
|
|
|
|
|
|
|
|
| Glutathione metabolism |
KEGG |
12 |
0.002 |
2 |
0.042 |
|
|
|
|
|
|
|
|
|
|
|
| Tyrosine metabolism |
KEGG |
11 |
0.003 |
2 |
0.037 |
|
|
|
|
|
|
|
|
|
|
|
|
|
|
|
|
|
|
|
|
|
|
|
|
|
|
|
|