| _________________________________________ |
|
|
|
|
|
|
|
|
|
|
|
|
|
|
|
|
| Pathways co-expressed in the 2 data sets with co-expressed pathways (with more than 6 annotation points each); only pathways with a total score of more than 20 points are shown |
|
Find below a list of pathways that are co-expressed with the bait. First a list of pathways is given that are co-expressed in all data sets. Lists for each individual dataset are shown underneath. Depending on the number of co-expressed pathways only the top scoring pathways are given; all data can be saved as text using the link above. |

|
|
|
|
|
|
|
|
| Pathway |
Source |
Sum of scores |
Sum of genes |
|
|
|
|
|
|
|
|
| Biosynthesis of Amino Acids and Derivatives |
BioPath |
102 |
17 |
|
|
|
|
|
|
|
|
| Methionin/SAM/ethylene metabolism from cysteine and aspartate |
BioPath |
80 |
12 |
|
|
|
|
|
|
|
|
| Phenylpropanoid pathway |
LitPath |
76 |
13 |
|
|
|
|
|
|
|
|
| Inositol phosphate metabolism |
KEGG |
75 |
24 |
|
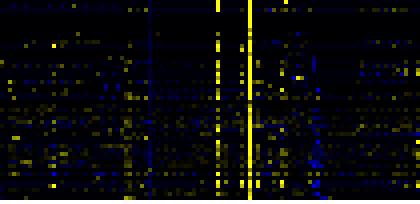
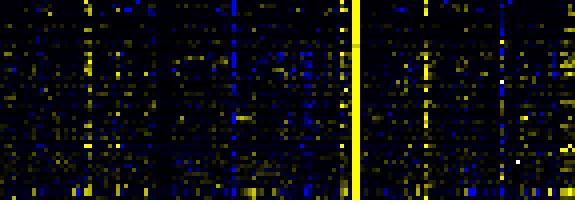
To the right of each table a thumbnail of the actual co-expression heatmap is given. Klick on the link to see the heatmap containing all co-expressed genes. |
|
|
|
|
|
|
|
|
|
| lignin biosynthesis |
AraCyc |
72 |
12 |
|
|
|
|
|
|
|
|
|
|
| lignin biosynthesis |
AraCyc |
72 |
12 |
|
|
|
|
|
|
|
|
|
|
| Benzoate degradation via CoA ligation |
KEGG |
71 |
23 |
|
For more information on how these pathway maps were generated please read the methods page |
|
|
|
|
|
|
|
|
|
| Nicotinate and nicotinamide metabolism |
KEGG |
71 |
23 |
|
|
|
|
|
|
|
|
|
|
| Lipid signaling |
AcylLipid |
68 |
21 |
|
|
|
|
|
|
|
|
|
|
|
|
|
| Aromatic amino acid (Phe, Tyr, Trp) metabolism |
BioPath |
56 |
8 |
|
|
|
|
|
|
|
|
|
|
|
|
|
| secondary metabolism |
FunCat |
54 |
10 |
|
|
|
|
|
|
|
|
|
|
|
|
|
| Propanoate metabolism |
KEGG |
54 |
9 |
|
|
|
|
|
|
|
|
|
|
|
|
|
| jasmonic acid biosynthesis |
TAIR-GO |
52 |
10 |
|
|
|
|
|
|
|
|
|
|
|
|
|
| jasmonic acid biosynthesis |
TAIR-GO |
52 |
10 |
|
|
|
|
|
|
|
|
|
|
|
|
|
| biosynthesis of proto- and siroheme |
AraCyc |
48 |
6 |
|
|
|
|
|
|
|
|
|
|
|
|
|
| triacylglycerol degradation |
AraCyc |
47.5 |
13 |
|
|
|
|
|
|
|
|
|
|
|
|
|
| ethylene biosynthesis |
TAIR-GO |
44 |
7 |
|
|
|
|
|
|
|
|
|
|
|
|
|
| Chlorophyll biosynthesis and breakdown |
BioPath |
40 |
4 |
|
|
|
|
|
|
|
|
|
|
|
|
|
| Porphyrin and chlorophyll metabolism |
KEGG |
40 |
4 |
|
|
|
|
|
|
|
|
|
|
|
|
|
| chlorophyll and phytochromobilin metabolism |
LitPath |
40 |
4 |
|
|
|
|
|
|
|
|
|
|
|
|
|
| biogenesis of chloroplast |
FunCat |
38 |
5 |
|
|
|
|
|
|
|
|
|
|
|
|
|
| intracellular signalling |
FunCat |
31 |
10 |
|
|
|
|
|
|
|
|
|
|
|
|
|
| Nucleotide sugars metabolism |
KEGG |
30 |
9 |
|
|
|
|
|
|
|
|
|
|
|
|
|
| chlorophyll biosynthesis |
AraCyc |
28 |
4 |
|
|
|
|
|
|
|
|
|
|
|
|
|
| salicylic acid biosynthesis |
TAIR-GO |
27 |
3 |
|
|
|
|
|
|
|
|
|
|
|
|
|
| salicylic acid biosynthesis |
TAIR-GO |
27 |
3 |
|
|
|
|
|
|
|
|
|
|
|
|
|
| N-terminal protein myristoylation |
TAIR-GO |
27 |
3 |
|
|
|
|
|
|
|
|
|
|
|
|
|
| lipoxygenase pathway |
AraCyc |
26 |
5 |
|
|
|
|
|
|
|
|
|
|
|
|
|
| Ion channels |
KEGG |
24 |
12 |
|
|
|
|
|
|
|
|
|
|
|
|
|
| Ligand-Receptor Interaction |
KEGG |
24 |
12 |
|
|
|
|
|
|
|
|
|
|
|
|
|
| Alanine and aspartate metabolism |
KEGG |
24 |
4 |
|
|
|
|
|
|
|
|
|
|
|
|
|
| beta-Alanine metabolism |
KEGG |
24 |
4 |
|
|
|
|
|
|
|
|
|
|
|
|
|
| Butanoate metabolism |
KEGG |
24 |
4 |
|
|
|
|
|
|
|
|
|
|
|
|
|
| Glutamate metabolism |
KEGG |
24 |
4 |
|
|
|
|
|
|
|
|
|
|
|
|
|
| Taurine and hypotaurine metabolism |
KEGG |
24 |
4 |
|
|
|
|
|
|
|
|
|
|
|
|
|
| response to wounding |
TAIR-GO |
24 |
6 |
|
|
|
|
|
|
|
|
|
|
|
|
|
| defense response |
TAIR-GO |
23.5 |
5 |
|
|
|
|
|
|
|
|
|
|
|
|
|
| Leaf Glycerolipid Biosynthesis in cytosol / ER |
BioPath |
22 |
7 |
|
|
|
|
|
|
|
|
|
|
|
|
|
| respiration |
FunCat |
22 |
3 |
|
|
|
|
|
|
|
|
|
|
|
|
|
|
|
|
|
|
|
|
|
|
|
|
|
|
|
|
|
|
|
|
|
|
|
|
|
|
|
|
|
|
|
|
|
|
|
| Pathways co-expressed in the Hormone etc. data set (with more than 15 annotation points) |
|
CYP82C3 (At4g31950) and /or CYP82C2 (At4g31970) and / or CYP82C4 (At4g31940) |
|
|
|
|
|
|
|
|
| max. difference between log2-ratios: |
8.3 |
|
|
|
|
|
|
|
|
|
|
|
|
| max. difference between log2-ratios excluding lowest and highest 5%: |
0.0 |
|
|
|
|
|
|
|
|
|
|
|
|
| Pathway |
Source |
Scores of Genes |
p[Score] |
No. of Genes |
p[genes] |
Link to hormones etc. heatmap |
|
|
|
|
|
|
|
| Biosynthesis of Amino Acids and Derivatives |
BioPath |
52 |
0.000 |
9 |
0.003 |
|
|
|
|
|
|
| Methionin/SAM/ethylene metabolism from cysteine and aspartate |
BioPath |
44 |
0.000 |
7 |
0.000 |
|
|
|
|
|
| Miscellaneous acyl lipid metabolism |
AcylLipid |
38 |
0.000 |
9 |
0.103 |
|
|
|
|
|
| Inositol phosphate metabolism |
KEGG |
37 |
0.000 |
13 |
0.000 |
|
|
|
|
|
| Lipid signaling |
AcylLipid |
34 |
0.000 |
10 |
0.026 |
|
|
|
|
|
| Benzoate degradation via CoA ligation |
KEGG |
33 |
0.000 |
12 |
0.000 |
|
|
|
|
|
| Nicotinate and nicotinamide metabolism |
KEGG |
33 |
0.000 |
12 |
0.000 |
|
|
|
|
|
| secondary metabolism |
FunCat |
32 |
0.000 |
6 |
0.000 |
|
|
|
|
|
| Plastidial Isoprenoids (Chlorophylls, Carotenoids, Tocopherols, Plastoquinone, Phylloquinone) |
BioPath |
30 |
0.000 |
3 |
0.111 |
|
|
|
|
|
| Phenylpropanoid pathway |
LitPath |
30 |
0.000 |
5 |
0.012 |
|
|
|
|
|
| triacylglycerol degradation |
AraCyc |
29.5 |
0.000 |
8 |
0.000 |
|
|
|
|
|
| Propanoate metabolism |
KEGG |
28 |
0.000 |
5 |
0.000 |
|
|
|
|
|
| Glycan Biosynthesis and Metabolism |
KEGG |
25 |
0.000 |
7 |
0.001 |
|
|
|
|
|
|
|
|
|
|
|
| ethylene biosynthesis |
TAIR-GO |
24 |
0.000 |
4 |
0.000 |
|
|
|
|
|
|
|
|
|
|
|
| biosynthesis of proto- and siroheme |
AraCyc |
24 |
0.000 |
3 |
0.004 |
|
|
|
|
|
|
|
|
|
|
|
| lignin biosynthesis |
AraCyc |
22 |
0.000 |
5 |
0.000 |
|
|
|
|
|
|
|
|
|
|
|
| cellulose biosynthesis |
BioPath |
20 |
0.000 |
3 |
0.017 |
|
|
|
|
|
|
|
|
|
|
|
| Chlorophyll biosynthesis and breakdown |
BioPath |
20 |
0.000 |
2 |
0.036 |
|
|
|
|
|
|
|
|
|
|
|
| Porphyrin and chlorophyll metabolism |
KEGG |
20 |
0.000 |
2 |
0.059 |
|
|
|
|
|
|
|
|
|
|
|
| chlorophyll and phytochromobilin metabolism |
LitPath |
20 |
0.000 |
2 |
0.052 |
|
|
|
|
|
|
|
|
|
|
|
| systemic acquired resistance |
TAIR-GO |
19.5 |
0.000 |
3 |
0.000 |
|
|
|
|
|
|
|
|
|
|
|
| hemicellulose biosynthesis |
BioPath |
16 |
0.000 |
2 |
0.005 |
|
|
|
|
|
|
|
|
|
|
|
| Fructose and mannose metabolism |
KEGG |
16 |
0.001 |
2 |
0.197 |
|
|
|
|
|
|
|
|
|
|
|
| Glycerolipid metabolism |
KEGG |
16 |
0.000 |
2 |
0.096 |
|
|
|
|
|
|
|
|
|
|
|
|
|
|
|
|
|
|
|
|
|
|
|
|
|
|
|
|
|
|
|
|
|
|
|
|
|
|
|
|
|
|
|
|
|
|
|
|
|
|
|
|
|
|
|
|
|
|
|
|
|
|
| Pathways co-expressed in the Mutant data set (with more than 15 annotation points) |
|
CYP82C3 (At4g31950) and /or CYP82C2 (At4g31970) and / or CYP82C4 (At4g31940) |
|
|
|
|
|
|
|
|
| max. difference between log2-ratios: |
17.5 |
|
|
|
|
|
|
|
|
|
|
|
|
| max. difference between log2-ratios excluding lowest and highest 5%: |
0.0 |
|
|
|
|
|
|
|
|
|
|
|
|
| Pathway |
Source |
Scores of Genes |
p[Score] |
No. of Genes |
p[genes] |
Link to mutants heatmap |
|
|
|
|
|
|
|
| Phenylpropanoid Metabolism |
BioPath |
68 |
0.000 |
10 |
0.003 |
|
|
|
|
| Biosynthesis of Amino Acids and Derivatives |
BioPath |
50 |
0.000 |
8 |
0.022 |
|
|
|
| Shikimate pathway |
LitPath |
48 |
0.000 |
7 |
0.000 |
|
|
|
| Phenylpropanoid pathway |
LitPath |
46 |
0.000 |
8 |
0.007 |
|
|
|
| tryptophan biosynthesis |
TAIR-GO |
44 |
0.000 |
6 |
0.000 |
|
|
|
| tryptophan biosynthesis |
AraCyc |
44 |
0.000 |
6 |
0.000 |
|
|
|
| Trp biosyntesis |
LitPath |
44 |
0.000 |
6 |
0.000 |
|
|
|
| Aromatic amino acid (Phe, Tyr, Trp) metabolism |
BioPath |
42 |
0.000 |
6 |
0.000 |
|
|
|
| Benzoate degradation via CoA ligation |
KEGG |
38 |
0.000 |
11 |
0.000 |
|
|
|
| Inositol phosphate metabolism |
KEGG |
38 |
0.000 |
11 |
0.000 |
|
|
|
| Nicotinate and nicotinamide metabolism |
KEGG |
38 |
0.000 |
11 |
0.000 |
|
|
|
| Methionin/SAM/ethylene metabolism from cysteine and aspartate |
BioPath |
36 |
0.000 |
5 |
0.000 |
|
|
|
| response to pathogenic bacteria |
TAIR-GO |
34 |
0.000 |
5 |
0.000 |
|
|
|
|
|
|
|
|
|
|
|
| Lipid signaling |
AcylLipid |
34 |
0.015 |
11 |
0.035 |
|
|
|
|
|
|
|
|
|
|
|
| lignin biosynthesis |
AraCyc |
30 |
0.000 |
5 |
0.000 |
|
|
|
|
|
|
|
|
|
|
|
| core phenylpropanoid metabolism |
BioPath |
26 |
0.000 |
4 |
0.005 |
|
|
|
|
|
|
|
|
|
|
|
| Propanoate metabolism |
KEGG |
26 |
0.000 |
4 |
0.002 |
|
|
|
|
|
|
|
|
|
|
|
| biosynthesis of proto- and siroheme |
AraCyc |
24 |
0.000 |
3 |
0.015 |
|
|
|
|
|
|
|
|
|
|
|
| biogenesis of chloroplast |
FunCat |
24 |
0.000 |
3 |
0.043 |
|
|
|
|
|
|
|
|
|
|
|
| secondary metabolism |
FunCat |
22 |
0.000 |
4 |
0.009 |
|
|
|
|
|
|
|
|
|
|
|
| Phenylalanine, tyrosine and tryptophan biosynthesis |
KEGG |
22 |
0.000 |
3 |
0.040 |
|
|
|
|
|
|
|
|
|
|
|
| Synthesis of membrane lipids in endomembrane system |
AcylLipid |
22 |
0.002 |
5 |
0.052 |
|
|
|
|
|
|
|
|
|
|
|
| intracellular signalling |
FunCat |
21 |
0.000 |
6 |
0.000 |
|
|
|
|
|
|
|
|
|
|
|
| Chlorophyll biosynthesis and breakdown |
BioPath |
20 |
0.000 |
2 |
0.049 |
|
|
|
|
|
|
|
|
|
|
|
| ethylene biosynthesis |
TAIR-GO |
20 |
0.000 |
3 |
0.000 |
|
|
|
|
|
|
|
|
|
|
|
| Porphyrin and chlorophyll metabolism |
KEGG |
20 |
0.000 |
2 |
0.047 |
|
|
|
|
|
|
|
|
|
|
|
| chlorophyll and phytochromobilin metabolism |
LitPath |
20 |
0.032 |
2 |
0.199 |
|
|
|
|
|
|
|
|
|
|
|
| N-terminal protein myristoylation |
TAIR-GO |
18 |
0.000 |
2 |
0.003 |
|
|
|
|
|
|
|
|
|
|
|
| triacylglycerol degradation |
AraCyc |
18 |
0.000 |
5 |
0.001 |
|
|
|
|
|
|
|
|
|
|
|
| Nucleotide sugars metabolism |
KEGG |
18 |
0.000 |
5 |
0.000 |
|
|
|
|
|
|
|
|
|
|
|
| defense response |
TAIR-GO |
17 |
0.000 |
3 |
0.002 |
|
|
|
|
|
|
|
|
|
|
|
| C-compound and carbohydrate utilization |
FunCat |
17 |
0.000 |
4 |
0.000 |
|
|
|
|
|
|
|
|
|
|
|
| jasmonic acid biosynthesis |
TAIR-GO |
16 |
0.000 |
3 |
0.002 |
|
|
|
|
|
|
|
|
|
|
|
| jasmonic acid biosynthesis |
AraCyc |
16 |
0.000 |
3 |
0.001 |
|
|
|
|
|
|
|
|
|
|
|
| lipoxygenase pathway |
AraCyc |
16 |
0.000 |
3 |
0.000 |
|
|
|
|
|
|
|
|
|
|
|
| phospholipid biosynthesis II |
AraCyc |
16 |
0.000 |
3 |
0.002 |
|
|
|
|
|
|
|
|
|
|
|
|
|
|
|
|
|
|
|
|
|
|
|
|
|
|
|
|