
| Co-Expression Analysis of: | CYPedia Home | Institut de Biologie Moléculaire des Plantes (Home) | ||||||||||||||
| CYP82C2 (At4g31970) and / or CYP82C4 (At4g31940) | save all data as Tab Delimited Table | |||||||||||||||
| _________________________________________ | ||||||||||||||||
| Pathways co-expressed in the 3 data sets with co-expressed pathways (with more than 6 annotation points each) | Find below a list of pathways that are co-expressed with the bait. First a list of pathways is given that are co-expressed in all data sets. Lists for each individual dataset are shown underneath. Depending on the number of co-expressed pathways only the top scoring pathways are given; all data can be saved as text using the link above. |
|
||||||||||||||
| there are no pathways co-expressed in the 3 data sets applicable | ||||||||||||||||
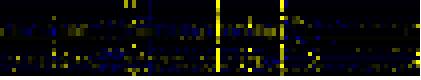
| To the right of each table a thumbnail of the actual co-expression heatmap is given. Klick on the link to see the heatmap containing all co-expressed genes. | ||||||||||||||||
| For more information on how these pathway maps were generated please read the methods page | ||||||||||||||||
| Pathways co-expressed in the Organ and Tissue data set (with more than 6 annotation points) | CYP82C2 (At4g31970) and / or CYP82C4 (At4g31940) | |||||||||||||||
| max. difference between log2-ratios: | 6.7 | |||||||||||||||
| max. difference between log2-ratios excluding lowest and highest 5%: | 0.0 | |||||||||||||||
| Pathway | Source | Scores of Genes | p[Score] | No. of Genes | p[genes] | Link to organ heatmap | ||||||||||
| Methane metabolism | KEGG | 8 | 0.000 | 3 | 0.000 | |||||||||||
| Phenylalanine metabolism | KEGG | 8 | 0.000 | 3 | 0.000 | |||||||||||
| Prostaglandin and leukotriene metabolism | KEGG | 8 | 0.000 | 3 | 0.000 | |||||||||||
| Stilbene, coumarine and lignin biosynthesis | KEGG | 8 | 0.000 | 3 | 0.000 | |||||||||||
| Pathways co-expressed in the Stress data set ( with more than 6 annotation points) | CYP82C2 (At4g31970) and / or CYP82C4 (At4g31940) | |||||||||||||||
| max. difference between log2-ratios: | 13.1 | |||||||||||||||
| max. difference between log2-ratios excluding lowest and highest 5%: | 6.5 | |||||||||||||||
| Pathway | Source | Scores of Genes | p[Score] | No. of Genes | p[genes] | Link to stress heatmap | ||||||||||
| Aromatic amino acid (Phe, Tyr, Trp) metabolism | BioPath | 10 | 0.000 | 1 | 0.000 | |||||||||||
| Phenylpropanoid Metabolism | BioPath | 10 | 0.000 | 1 | 0.004 | |||||||||||
| anthranilate synthase complex | TAIR-GO | 10 | 0.000 | 1 | 0.000 | |||||||||||
| response to pathogenic bacteria | TAIR-GO | 10 | 0.000 | 1 | 0.000 | |||||||||||
| response to wounding | TAIR-GO | 10 | 0.000 | 1 | 0.002 | |||||||||||
| tryptophan biosynthesis | TAIR-GO | 10 | 0.000 | 1 | 0.001 | |||||||||||
| tryptophan biosynthesis | AraCyc | 10 | 0.000 | 1 | 0.000 | |||||||||||
| Phenylalanine, tyrosine and tryptophan biosynthesis | KEGG | 10 | 0.000 | 1 | 0.000 | |||||||||||
| Shikimate pathway | LitPath | 10 | 0.000 | 1 | 0.010 | |||||||||||
| Trp biosyntesis | LitPath | 10 | 0.000 | 1 | 0.002 | |||||||||||
| Pathways co-expressed in the Hormone etc. data set (with more than 6 annotation points) | CYP82C2 (At4g31970) and / or CYP82C4 (At4g31940) | |||||||||||||||
| max. difference between log2-ratios: | 6.0 | |||||||||||||||
| max. difference between log2-ratios excluding lowest and highest 5%: | 0.0 | |||||||||||||||
| Pathway | Source | Scores of Genes | p[Score] | No. of Genes | p[genes] | Link to hormones etc. heatmap | ||||||||||
| Methane metabolism | KEGG | 10 | 0.000 | 5 | 0.000 |
|
||||||||||
| Phenylalanine metabolism | KEGG | 10 | 0.000 | 5 | 0.000 | |||||||||||
| Prostaglandin and leukotriene metabolism | KEGG | 10 | 0.000 | 5 | 0.000 | |||||||||||
| Stilbene, coumarine and lignin biosynthesis | KEGG | 10 | 0.000 | 5 | 0.000 | |||||||||||
| Phenylpropanoid pathway | LitPath | 8 | 0.000 | 2 | 0.006 | |||||||||||
| Pathways co-expressed in the Mutant data set (with more than 10 annotation points) | CYP82C2 (At4g31970) and / or CYP82C4 (At4g31940) | |||||||||||||||
| max. difference between log2-ratios: | 10.4 | |||||||||||||||
| max. difference between log2-ratios excluding lowest and highest 5%: | 2.8 | |||||||||||||||
| Link to mutants heatmap | ||||||||||||||||
| there are no co-expressed genes with more than 6 annotation points |
|
|||||||||||||||
| page created by Juergen Ehlting | 04/04/06 | |||||||||||||||