|
|
|
|
|
|
|
|
|
|
|
|
|
|
|
|
|
|
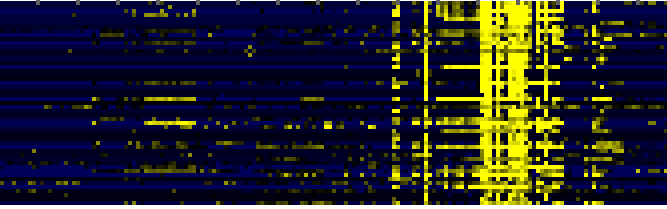
| Pathways co-expressed in the Organ and Tissue data set (with more than 6 annotation points) |
|
CYP86A4 (At1g01600) |
|
|
|
|
|
|
|
|
|
| max. difference between log2-ratios: |
3.6 |
|
|
|
|
|
|
|
|
|
|
|
|
|
| max. difference between log2-ratios excluding lowest and highest 5%: |
7.3 |
|
|
|
|
|
|
|
|
|
|
|
|
|
| Pathway |
Source |
Scores of Genes |
p[Score] |
No. of Genes |
p[genes] |
Link to organ heatmap |
|
|
|
|
|
|
|
|
| Miscellaneous acyl lipid metabolism |
AcylLipid |
40 |
0.000 |
10 |
0.001 |
|
|
|
|
| Fatty acid elongation and wax and cutin metabolism |
AcylLipid |
22 |
0.000 |
4 |
0.036 |
|
|
|
| sexual reproduction |
TAIR-GO |
20 |
0.000 |
5 |
0.000 |
|
|
|
| fatty acid metabolism |
TAIR-GO |
18 |
0.000 |
2 |
0.000 |
|
|
|
| Cell Wall Carbohydrate Metabolism |
BioPath |
12 |
0.000 |
3 |
0.110 |
|
|
|
| pectin metabolism |
BioPath |
12 |
0.000 |
3 |
0.008 |
|
|
|
| Gluconeogenesis from lipids in seeds |
BioPath |
10 |
0.000 |
1 |
0.055 |
|
|
|
| fatty acid oxidation pathway |
AraCyc |
10 |
0.000 |
1 |
0.002 |
|
|
|
| octane oxidation |
AraCyc |
10 |
0.000 |
1 |
0.001 |
|
|
|
| mono-/sesqui-/di-terpene biosynthesis |
LitPath |
10 |
0.000 |
1 |
0.037 |
|
|
|
| sequiterpene biosynthesis |
LitPath |
10 |
0.000 |
1 |
0.000 |
|
|
|
| terpenoid metabolism |
LitPath |
10 |
0.000 |
1 |
0.039 |
|
|
|
| cellulose biosynthesis |
AraCyc |
8 |
0.000 |
2 |
0.001 |
|
|
|
| cuticle biosynthesis |
TAIR-GO |
7 |
0.000 |
1 |
0.003 |
|
|
|
|
|
|
|
|
|
|
|
|
| wax biosynthesis |
TAIR-GO |
7 |
0.000 |
1 |
0.001 |
|
|
|
|
|
|
|
|
|
|
|
|
| epicuticular wax biosynthesis |
AraCyc |
7 |
0.000 |
1 |
0.000 |
|
|
|
|
|
|
|
|
|
|
|
|
|
|
|
|
|
|
|
|
|
|
|
|
|
|
|
|
|
|
|
|
|
|
|
|
|
|
|
|
|
|
|
|
|
|
|
|
| Pathways co-expressed in the Hormone etc. data set (with more than 6 annotation points) |
|
CYP86A4 (At1g01600) |
|
|
|
|
|
|
|
|
|
| max. difference between log2-ratios: |
2.3 |
|
|
|
|
|
|
|
|
|
|
|
|
|
| max. difference between log2-ratios excluding lowest and highest 5%: |
3.8 |
|
|
|
|
|
|
|
|
|
|
|
|
|
| Pathway |
Source |
Scores of Genes |
p[Score] |
No. of Genes |
p[genes] |
Link to hormones etc. heatmap |
|
|
|
|
|
|
|
|
| Miscellaneous acyl lipid metabolism |
AcylLipid |
22 |
0.000 |
3 |
0.048 |

|
|
|
|
|
|
|
| Intermediary Carbon Metabolism |
BioPath |
20 |
0.000 |
2 |
0.001 |
|
|
|
|
|
|
| Cell Wall Carbohydrate Metabolism |
BioPath |
10 |
0.001 |
1 |
0.080 |
|
|
|
|
|
|
| UDP-carbohydrate metabolism |
BioPath |
10 |
0.000 |
1 |
0.000 |
|
|
|
|
|
|
| acetyl-CoA biosynthesis |
TAIR-GO |
10 |
0.000 |
1 |
0.000 |
|
|
|
|
|
|
| citrate lyase complex |
TAIR-GO |
10 |
0.000 |
1 |
0.000 |
|
|
|
|
|
|
|
|
|
|
|
|
| sugar mediated signaling |
TAIR-GO |
10 |
0.000 |
1 |
0.000 |
|
|
|
|
|
|
|
|
|
|
|
|
| C-compound and carbohydrate regulation of C-compound and carbohydrate utilization |
FunCat |
10 |
0.000 |
1 |
0.000 |
|
|
|
|
|
|
|
|
|
|
|
|
| C-compound and carbohydrate utilization |
FunCat |
10 |
0.000 |
1 |
0.000 |
|
|
|
|
|
|
|
|
|
|
|
|
| glycolysis and gluconeogenesis |
FunCat |
10 |
0.000 |
1 |
0.072 |
|
|
|
|
|
|
|
|
|
|
|
|
| regulation of C-compound and carbohydrate utilization |
FunCat |
10 |
0.000 |
1 |
0.000 |
|
|
|
|
|
|
|
|
|
|
|
|
| tricarboxylic-acid pathway (citrate cycle, Krebs cycle, TCA cycle) |
FunCat |
10 |
0.000 |
1 |
0.056 |
|
|
|
|
|
|
|
|
|
|
|
|
| Citrate cycle (TCA cycle) |
KEGG |
10 |
0.000 |
1 |
0.003 |
|
|
|
|
|
|
|
|
|
|
|
|
| fatty acid metabolism |
TAIR-GO |
9 |
0.000 |
1 |
0.002 |
|
|
|
|
|
|
|
|
|
|
|
|
| Fatty acid elongation and wax and cutin metabolism |
AcylLipid |
9 |
0.005 |
1 |
0.144 |
|
|
|
|
|
|
|
|
|
|
|
|
| Translation factors |
KEGG |
8 |
0.000 |
2 |
0.001 |
|
|
|
|
|
|
|
|
|
|
|
|
| cellulose biosynthesis |
AraCyc |
6.5 |
0.000 |
2 |
0.001 |
|
|
|
|
|
|
|
|
|
|
|
|
|
|
|
|
|
|
|
|
|
|
|
|
|
|
|
|
|
|