|
|
|
|
|
|
|
|
|
|
|
|
|
|
|
|
|
|
|
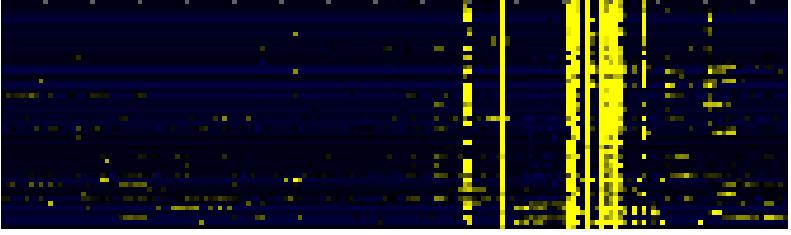
| Pathways co-expressed in the Organ and Tissue data set (with more than 6 annotation points) |
|
CYP86C4 (At1g13150) |
|
|
|
|
|
|
|
|
|
|
| max. difference between log2-ratios: |
2.3 |
|
|
|
|
|
|
|
|
|
|
|
|
|
|
| max. difference between log2-ratios excluding lowest and highest 5%: |
5.3 |
|
|
|
|
|
|
|
|
|
|
|
|
|
|
| Pathway |
Source |
Scores of Genes |
p[Score] |
No. of Genes |
p[genes] |
Link to organ heatmap |
|
|
|
|
|
|
|
|
|
| Miscellaneous acyl lipid metabolism |
AcylLipid |
42 |
0.000 |
15 |
0.001 |
|
|
|
|
| Fatty acid elongation and wax and cutin metabolism |
AcylLipid |
34 |
0.000 |
8 |
0.002 |
|
|
|
| fatty acid metabolism |
TAIR-GO |
26 |
0.000 |
4 |
0.000 |
|
|
|
| Isoprenoid Biosynthesis in the Cytosol and in Mitochondria |
BioPath |
22 |
0.000 |
4 |
0.000 |
|
|
|
| sexual reproduction |
TAIR-GO |
20 |
0.000 |
5 |
0.000 |
|
|
|
| Biosynthesis of prenyl diphosphates |
BioPath |
14 |
0.000 |
3 |
0.001 |
|
|
|
| triacylglycerol degradation |
AraCyc |
14 |
0.000 |
6 |
0.000 |
|
|
|
| polyisoprenoid biosynthesis |
AraCyc |
12 |
0.000 |
3 |
0.000 |
|
|
|
| gibberellic acid catabolism |
TAIR-GO |
10 |
0.000 |
1 |
0.001 |
|
|
|
| Diterpenoid biosynthesis |
KEGG |
10 |
0.000 |
1 |
0.000 |
|
|
|
| Gibberellin metabolism |
LitPath |
10 |
0.000 |
1 |
0.024 |
|
|
|
| giberelin catabolism |
LitPath |
10 |
0.000 |
1 |
0.000 |
|
|
|
| prenyl diphosphate (GPP,FPP, GGPP) biosynthesis |
LitPath |
10 |
0.000 |
1 |
0.019 |
|
|
|
| lignin biosynthesis |
AraCyc |
9 |
0.000 |
4 |
0.000 |
|
|
|
| Phenylpropanoid pathway |
LitPath |
9 |
0.011 |
4 |
0.003 |
|
|
|
| pectin metabolism |
BioPath |
8 |
0.000 |
2 |
0.149 |
|
|
|
|
|
|
|
|
|
|
|
|
|
| ubiquinone biosynthesis |
BioPath |
8 |
0.000 |
1 |
0.000 |
|
|
|
|
|
|
|
|
|
|
|
|
|
| cuticle biosynthesis |
TAIR-GO |
8 |
0.000 |
2 |
0.000 |
|
|
|
|
|
|
|
|
|
|
|
|
|
| long-chain fatty acid metabolism |
TAIR-GO |
8 |
0.000 |
2 |
0.000 |
|
|
|
|
|
|
|
|
|
|
|
|
|
| very-long-chain fatty acid metabolism |
TAIR-GO |
8 |
0.000 |
2 |
0.000 |
|
|
|
|
|
|
|
|
|
|
|
|
|
| biosynthesis of proto- and siroheme |
AraCyc |
8 |
0.000 |
1 |
0.040 |
|
|
|
|
|
|
|
|
|
|
|
|
|
| mevalonate pathway |
AraCyc |
8 |
0.000 |
1 |
0.009 |
|
|
|
|
|
|
|
|
|
|
|
|
|
| metabolism of vitamins, cofactors, and prosthetic groups |
FunCat |
8 |
0.000 |
1 |
0.000 |
|
|
|
|
|
|
|
|
|
|
|
|
|
| Ubiquinone biosynthesis |
KEGG |
8 |
0.000 |
1 |
0.000 |
|
|
|
|
|
|
|
|
|
|
|
|
|
| ubiquinone biosynthesis |
LitPath |
8 |
0.000 |
1 |
0.001 |
|
|
|
|
|
|
|
|
|
|
|
|
|
| suberin biosynthesis |
AraCyc |
7 |
0.000 |
3 |
0.000 |
|
|
|
|
|
|
|
|
|
|
|
|
|
|
|
|
|
|
|
|
|
|
|
|
|
|
|
|
|
|
|
|
|
|
|
|
|
|
|
|
|
|
|
|
|
|
|
|
|
|
|
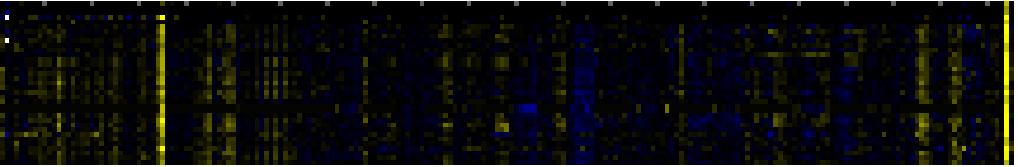
| Pathways co-expressed in the Stress data set ( with more than 6 annotation points) |
|
CYP86C4 (At1g13150) |
|
|
|
|
|
|
|
|
|
|
| max. difference between log2-ratios: |
0.0 |
|
|
|
|
|
|
|
|
|
|
|
|
|
|
| max. difference between log2-ratios excluding lowest and highest 5%: |
2.9 |
|
|
|
|
|
|
|
|
|
|
|
|
|
|
| Pathway |
Source |
Scores of Genes |
p[Score] |
No. of Genes |
p[genes] |
Link to stress heatmap |
|
|
|
|
|
|
|
|
|
| Folding, Sorting and Degradation |
KEGG |
138 |
0.000 |
26 |
0.000 |
|
| Proteasome |
KEGG |
138 |
0.000 |
26 |
0.000 |
| protein catabolism |
TAIR-GO |
116 |
0.000 |
20 |
0.000 |
| ubiquitin-dependent protein catabolism |
TAIR-GO |
116 |
0.000 |
20 |
0.000 |
| proteasome core complex (sensu Eukaryota) |
TAIR-GO |
66 |
0.000 |
11 |
0.000 |
| proteasome regulatory particle, base subcomplex (sensu Eukaryota) |
TAIR-GO |
38 |
0.000 |
6 |
0.000 |
| Benzoate degradation via CoA ligation |
KEGG |
18 |
0.000 |
2 |
0.168 |
| Inositol phosphate metabolism |
KEGG |
18 |
0.000 |
2 |
0.200 |
| Nicotinate and nicotinamide metabolism |
KEGG |
18 |
0.000 |
2 |
0.141 |
| cytoplasmic and nuclear protein degradation |
FunCat |
13 |
0.000 |
2 |
0.000 |
| N-terminal protein myristoylation |
TAIR-GO |
9 |
0.000 |
1 |
0.045 |
| phosphorylation |
TAIR-GO |
9 |
0.000 |
1 |
0.000 |
|
|
|
|
|
|
|
|
|
|
|
|
|
| protein amino acid phosphorylation |
TAIR-GO |
9 |
0.000 |
1 |
0.009 |
|
|
|
|
|
|
|
|
|
|
|
|
|
| calmodulin binding |
TAIR-GO |
7 |
0.001 |
1 |
0.061 |
|
|
|
|
|
|
|
|
|
|
|
|
|
|
|
|
|
|
|
|
|
|
|
|
|
|
|
|
|
|
|
|
|
|
|
|
|
|
|
|
|
|
|
|
|
|
|
|
|
|
|
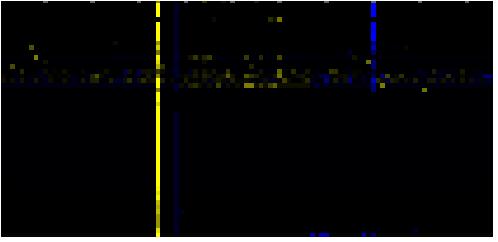
| Pathways co-expressed in the Hormone etc. data set (with more than 6 annotation points) |
|
CYP86C4 (At1g13150) |
|
|
|
|
|
|
|
|
|
|
| max. difference between log2-ratios: |
0.0 |
|
|
|
|
|
|
|
|
|
|
|
|
|
|
| max. difference between log2-ratios excluding lowest and highest 5%: |
3.4 |
|
|
|
|
|
|
|
|
|
|
|
|
|
|
| Pathway |
Source |
Scores of Genes |
p[Score] |
No. of Genes |
p[genes] |
Link to hormones heatmap |
|
|
|
|
|
|
|
|
|
| Cell Wall Carbohydrate Metabolism |
BioPath |
81 |
0.000 |
18 |
0.000 |
|
|
|
|
|
|
|
| pectin metabolism |
BioPath |
59 |
0.000 |
14 |
0.000 |
|
|
|
|
|
|
| Starch and sucrose metabolism |
KEGG |
43 |
0.000 |
7 |
0.000 |
|
|
|
|
|
|
| mono-/sesqui-/di-terpene biosynthesis |
LitPath |
30 |
0.000 |
3 |
0.000 |
|
|
|
|
|
|
| terpenoid metabolism |
LitPath |
30 |
0.000 |
3 |
0.000 |
|
|
|
|
|
|
| Miscellaneous acyl lipid metabolism |
AcylLipid |
20 |
0.000 |
7 |
0.000 |
|
|
|
|
|
|
| sucrose metabolism |
BioPath |
16 |
0.000 |
2 |
0.002 |
|
|
|
|
|
|
| Galactose metabolism |
KEGG |
16 |
0.000 |
2 |
0.000 |
|
|
|
|
|
|
| C-compound and carbohydrate utilization |
FunCat |
14 |
0.000 |
2 |
0.000 |
|
|
|
|
|
|
| sexual reproduction |
TAIR-GO |
12 |
0.000 |
3 |
0.000 |
|
|
|
|
|
|
| monoterpenoid biosynthesis |
TAIR-GO |
10 |
0.000 |
1 |
0.000 |
|
|
|
|
|
|
| N-terminal protein myristoylation |
TAIR-GO |
10 |
0.000 |
1 |
0.002 |
|
|
|
|
|
|
| monoterpene biosynthesis |
AraCyc |
10 |
0.000 |
1 |
0.000 |
|
|
|
|
|
|
| plant monoterpene biosynthesis |
AraCyc |
10 |
0.000 |
1 |
0.000 |
|
|
|
|
|
|
| monoterpene biosynthesis |
LitPath |
10 |
0.000 |
1 |
0.001 |
|
|
|
|
|
|
| cellulose biosynthesis |
AraCyc |
8 |
0.000 |
2 |
0.000 |
|
|
|
|
|
|
|
|
|
|
|
|
|
| lactose degradation IV |
AraCyc |
8 |
0.000 |
2 |
0.000 |
|
|
|
|
|
|
|
|
|
|
|
|
|
| Oxidative phosphorylation |
KEGG |
8 |
0.000 |
2 |
0.006 |
|
|
|
|
|
|
|
|
|
|
|
|
|
| Pentose and glucuronate interconversions |
KEGG |
8 |
0.000 |
2 |
0.000 |
|
|
|
|
|
|
|
|
|
|
|
|
|
|
|
|
|
|
|
|
|
|
|
|
|
|
|
|
|
|
|
|
|
|
|
|
|
|
|
|
|
|
|
|
|
|
|
|
|
|
|
|
|
|
|
|
|
|
|
|
|
|
|
|
|
|
|
|
|
|
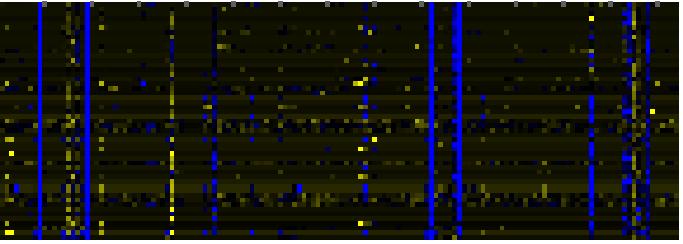
| Pathways co-expressed in the Mutant data set (with more than 6 annotation points) |
|
CYP86C4 (At1g13150) |
|
|
|
|
|
|
|
|
|
|
| max. difference between log2-ratios: |
1.3 |
|
|
|
|
|
|
|
|
|
|
|
|
|
|
| max. difference between log2-ratios excluding lowest and highest 5%: |
5.9 |
|
|
|
|
|
|
|
|
|
|
|
|
|
|
| Pathway |
Source |
Scores of Genes |
p[Score] |
No. of Genes |
p[genes] |
Link to mutants heatmap |
|
|
|
|
|
|
|
|
|
| Cell Wall Carbohydrate Metabolism |
BioPath |
91 |
0.000 |
22 |
0.000 |
|
|
|
|
|
| pectin metabolism |
BioPath |
75 |
0.000 |
19 |
0.000 |
|
|
|
|
| Miscellaneous acyl lipid metabolism |
AcylLipid |
46 |
0.000 |
17 |
0.000 |
|
|
|
|
| C-compound and carbohydrate metabolism |
FunCat |
40 |
0.000 |
12 |
0.006 |
|
|
|
|
| Starch and sucrose metabolism |
KEGG |
33 |
0.000 |
6 |
0.000 |
|
|
|
|
| Phenylpropanoid pathway |
LitPath |
29 |
0.000 |
6 |
0.000 |
|
|
|
|
| biogenesis of cell wall |
FunCat |
28 |
0.000 |
9 |
0.000 |
|
|
|
|
| Glycan Biosynthesis and Metabolism |
KEGG |
26 |
0.000 |
4 |
0.001 |
|
|
|
|
| core phenylpropanoid metabolism |
BioPath |
22 |
0.000 |
3 |
0.025 |
|
|
|
|
| Isoprenoid Biosynthesis in the Cytosol and in Mitochondria |
BioPath |
20 |
0.001 |
3 |
0.073 |
|
|
|
|
| sexual reproduction |
TAIR-GO |
20 |
0.000 |
5 |
0.000 |
|
|
|
|
| glycolysis and gluconeogenesis |
FunCat |
16 |
0.024 |
4 |
0.126 |
|
|
|
|
| Fatty acid elongation and wax and cutin metabolism |
AcylLipid |
15 |
0.009 |
5 |
0.103 |
|
|
|
|
| Glutamate/glutamine from nitrogen fixation |
BioPath |
14 |
0.000 |
2 |
0.004 |
|
|
|
|
| lactose degradation IV |
AraCyc |
14 |
0.000 |
4 |
0.000 |
|
|
|
|
| assimilation of ammonia, metabolism of the glutamate group |
FunCat |
14 |
0.000 |
2 |
0.011 |
|
|
|
|
|
|
|
|
|
|
|
|
|
| nitrogen and sulfur metabolism |
FunCat |
14 |
0.000 |
2 |
0.010 |
|
|
|
|
|
|
|
|
|
|
|
|
|
| Glutamate metabolism |
KEGG |
14 |
0.000 |
2 |
0.017 |
|
|
|
|
|
|
|
|
|
|
|
|
|
| Glycerolipid metabolism |
KEGG |
14 |
0.000 |
2 |
0.008 |
|
|
|
|
|
|
|
|
|
|
|
|
|
| Nitrogen metabolism |
KEGG |
14 |
0.000 |
2 |
0.008 |
|
|
|
|
|
|
|
|
|
|
|
|
|
| Oxidative phosphorylation |
KEGG |
14 |
0.000 |
3 |
0.014 |
|
|
|
|
|
|
|
|
|
|
|
|
|
| Biosynthesis of prenyl diphosphates |
BioPath |
12 |
0.015 |
2 |
0.098 |
|
|
|
|
|
|
|
|
|
|
|
|
|
| triacylglycerol degradation |
AraCyc |
12 |
0.000 |
5 |
0.000 |
|
|
|
|
|
|
|
|
|
|
|
|
|
| Galactose metabolism |
KEGG |
12 |
0.000 |
2 |
0.007 |
|
|
|
|
|
|
|
|
|
|
|
|
|
| cellulose biosynthesis |
BioPath |
10 |
0.013 |
2 |
0.103 |
|
|
|
|
|
|
|
|
|
|
|
|
|
| gibberellic acid catabolism |
TAIR-GO |
10 |
0.000 |
1 |
0.001 |
|
|
|
|
|
|
|
|
|
|
|
|
|
| ammonia assimilation cycle |
AraCyc |
10 |
0.000 |
1 |
0.009 |
|
|
|
|
|
|
|
|
|
|
|
|
|
| glutamine biosynthesis I |
AraCyc |
10 |
0.000 |
1 |
0.005 |
|
|
|
|
|
|
|
|
|
|
|
|
|
| nitrate assimilation pathway |
AraCyc |
10 |
0.000 |
1 |
0.011 |
|
|
|
|
|
|
|
|
|
|
|
|
|
| polyisoprenoid biosynthesis |
AraCyc |
10 |
0.000 |
2 |
0.001 |
|
|
|
|
|
|
|
|
|
|
|
|
|
| lipid, fatty acid and isoprenoid metabolism |
FunCat |
10 |
0.003 |
4 |
0.002 |
|
|
|
|
|
|
|
|
|
|
|
|
|
| transport |
FunCat |
10 |
0.000 |
3 |
0.000 |
|
|
|
|
|
|
|
|
|
|
|
|
|
| Diterpenoid biosynthesis |
KEGG |
10 |
0.000 |
1 |
0.010 |
|
|
|
|
|
|
|
|
|
|
|
|
|
| Fructose and mannose metabolism |
KEGG |
10 |
0.001 |
2 |
0.021 |
|
|
|
|
|
|
|
|
|
|
|
|
|
| Peptidoglycan biosynthesis |
KEGG |
10 |
0.000 |
1 |
0.002 |
|
|
|
|
|
|
|
|
|
|
|
|
|
| Gibberellin metabolism |
LitPath |
10 |
0.000 |
1 |
0.034 |
|
|
|
|
|
|
|
|
|
|
|
|
|
| giberelin catabolism |
LitPath |
10 |
0.000 |
1 |
0.000 |
|
|
|
|
|
|
|
|
|
|
|
|
|
| prenyl diphosphate (GPP,FPP, GGPP) biosynthesis |
LitPath |
10 |
0.000 |
1 |
0.026 |
|
|
|
|
|
|
|
|
|
|
|
|
|
| cytokinin catabolism |
TAIR-GO |
9 |
0.000 |
1 |
0.001 |
|
|
|
|
|
|
|
|
|
|
|
|
|
| cytokinins degradation |
AraCyc |
9 |
0.000 |
1 |
0.001 |
|
|
|
|
|
|
|
|
|
|
|
|
|
| lignin biosynthesis |
AraCyc |
9 |
0.001 |
4 |
0.001 |
|
|
|
|
|
|
|
|
|
|
|
|
|
| hemicellulose biosynthesis |
BioPath |
8 |
0.000 |
1 |
0.060 |
|
|
|
|
|
|
|
|
|
|
|
|
|
| ubiquinone biosynthesis |
BioPath |
8 |
0.000 |
1 |
0.004 |
|
|
|
|
|
|
|
|
|
|
|
|
|
| cell wall organization and biogenesis (sensu Magnoliophyta) |
TAIR-GO |
8 |
0.000 |
1 |
0.000 |
|
|
|
|
|
|
|
|
|
|
|
|
|
| cuticle biosynthesis |
TAIR-GO |
8 |
0.000 |
2 |
0.000 |
|
|
|
|
|
|
|
|
|
|
|
|
|
| fatty acid metabolism |
TAIR-GO |
8 |
0.000 |
2 |
0.002 |
|
|
|
|
|
|
|
|
|
|
|
|
|
| long-chain fatty acid metabolism |
TAIR-GO |
8 |
0.000 |
2 |
0.001 |
|
|
|
|
|
|
|
|
|
|
|
|
|
| very-long-chain fatty acid metabolism |
TAIR-GO |
8 |
0.000 |
2 |
0.000 |
|
|
|
|
|
|
|
|
|
|
|
|
|
| biosynthesis of proto- and siroheme |
AraCyc |
8 |
0.001 |
1 |
0.147 |
|
|
|
|
|
|
|
|
|
|
|
|
|
| mevalonate pathway |
AraCyc |
8 |
0.000 |
1 |
0.038 |
|
|
|
|
|
|
|
|
|
|
|
|
|
|
|
|
|
|
|
|
|
|
|
|
|
|
|
|
|
|
|
|