| _________________________________________ |
|
|
|
|
|
|
|
|

|
|
|
|
|
|
|
| Pathways co-expressed in the 3 data sets with co-expressed pathways (with more than 6 annotation points each) |
|
Find below a list of pathways that are co-expressed with the bait. First a list of pathways is given that are co-expressed in all data sets. Lists for each individual dataset are shown underneath. Depending on the number of co-expressed pathways only the top scoring pathways are given; all data can be saved as text using the link above. |
|
|
|
|
|
|
| Pathway |
Source |
Sum of scores |
Sum of genes |
|
|
|
|
|
|
|
| Phenylpropanoid Metabolism |
BioPath |
110 |
11 |
|
|
|
|
|
|
|
| carotenoid biosynthesis |
AraCyc |
92 |
10 |
|
|
|
|
|
|
|
| carotenoid biosynthesis |
AraCyc |
92 |
10 |
|
|
|
|
|
|
|
|
|
| Glutathione metabolism |
KEGG |
86 |
12 |
|
To the right of each table a thumbnail of the actual co-expression heatmap is given. Klick on the link to see the heatmap containing all co-expressed genes. |
|
|
|
|
|
|
|
|
| Glucosyltransferases for benzoic acids |
BioPath |
80 |
8 |
|
|
|
|
|
|
|
|
|
| vitamin E biosynthesis |
AraCyc |
54 |
6 |
|
|
|
|
|
|
|
|
|
| vitamin E biosynthesis |
AraCyc |
54 |
6 |
|
For more information on how these pathway maps were generated please read the methods page |
|
|
|
|
|
|
|
|
| plastoquinone biosynthesis |
AraCyc |
44 |
5 |
|
|
|
|
|
|
|
|
|
| plastoquinone biosynthesis |
AraCyc |
44 |
5 |
|
|
|
|
|
|
|
|
|
|
|
|
|
| C-compound and carbohydrate utilization |
FunCat |
36 |
4 |
|
|
|
|
|
|
|
|
|
|
|
|
|
|
|
|
|
|
|
|
|
|
|
|
|
|
|
|
|
|
|
|
|
|
|
|
|
|
|
|
|
|
|
|
|
|
|
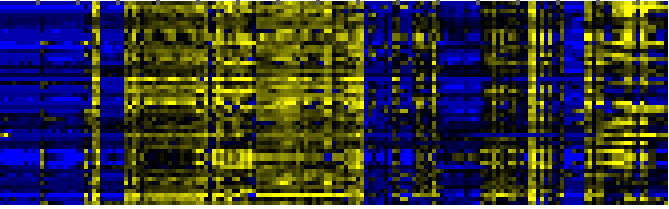
| Pathways co-expressed in the Organ and Tissue data set (with more than 17 annotation points) |
|
CYP89A2 (At1g64900) |
|
|
|
|
|
|
|
|
| max. difference between log2-ratios: |
5.8 |
|
|
|
|
|
|
|
|
|
|
|
|
| max. difference between log2-ratios excluding lowest and highest 5%: |
4.4 |
|
|
|
|
|
|
|
|
|
|
|
|
| Pathway |
Source |
Scores of Genes |
p[Score] |
No. of Genes |
p[genes] |
Link to organ heatmap |
|
|
|
|
|
|
|
| Plastidial Isoprenoids (Chlorophylls, Carotenoids, Tocopherols, Plastoquinone, Phylloquinone) |
BioPath |
118 |
0.000 |
14 |
0.000 |
|
|
|
| Carotenoid and abscisic acid metabolism |
LitPath |
75 |
0.000 |
10 |
0.000 |
|
|
| Carotenoid biosynthesis |
BioPath |
64 |
0.000 |
7 |
0.000 |
|
|
| carotenoid biosynthesis |
AraCyc |
64 |
0.000 |
7 |
0.000 |
|
|
| carotenid biosynthesis |
LitPath |
64 |
0.000 |
7 |
0.000 |
|
|
| Phenylpropanoid Metabolism |
BioPath |
60 |
0.001 |
6 |
0.421 |
|
|
| Glucosyltransferases for benzoic acids |
BioPath |
40 |
0.000 |
4 |
0.000 |
|
|
| Biosynthesis of steroids |
KEGG |
36 |
0.000 |
5 |
0.000 |
|
|
| Folding, Sorting and Degradation |
KEGG |
35 |
0.000 |
4 |
0.025 |
|
|
| ATP-dependent proteolysis |
TAIR-GO |
30 |
0.000 |
6 |
0.000 |
|
|
| transport |
FunCat |
30 |
0.000 |
4 |
0.000 |
|
|
| Miscellaneous acyl lipid metabolism |
AcylLipid |
30 |
0.000 |
6 |
0.034 |
|
|
| Biosynthesis of prenyl diphosphates |
BioPath |
28 |
0.000 |
5 |
0.004 |
|
|
| Chloroplastic protein turnover |
BioPath |
26 |
0.000 |
5 |
0.000 |
|
|
| biogenesis of chloroplast |
FunCat |
26 |
0.000 |
4 |
0.022 |
|
|
|
|
|
|
|
|
|
|
|
| energy |
FunCat |
26 |
0.000 |
5 |
0.000 |
|
|
|
|
|
|
|
|
|
|
|
| Protein export |
KEGG |
26 |
0.000 |
3 |
0.001 |
|
|
|
|
|
|
|
|
|
|
|
| vitamin E biosynthesis |
AraCyc |
24 |
0.000 |
3 |
0.000 |
|
|
|
|
|
|
|
|
|
|
|
| Tryptophan metabolism |
KEGG |
23 |
0.000 |
3 |
0.002 |
|
|
|
|
|
|
|
|
|
|
|
| biosynthesis of derivatives of homoisopentenyl pyrophosphate |
FunCat |
22 |
0.000 |
3 |
0.001 |
|
|
|
|
|
|
|
|
|
|
|
| photorespiration |
AraCyc |
21 |
0.000 |
5 |
0.000 |
|
|
|
|
|
|
|
|
|
|
|
| Pathway for nuclear-encoded, thylakoid-localized proteins |
BioPath |
20 |
0.000 |
2 |
0.010 |
|
|
|
|
|
|
|
|
|
|
|
| Tocopherol biosynthesis |
BioPath |
20 |
0.000 |
2 |
0.000 |
|
|
|
|
|
|
|
|
|
|
|
| carotene metabolism |
TAIR-GO |
20 |
0.000 |
2 |
0.000 |
|
|
|
|
|
|
|
|
|
|
|
| starch metabolism |
BioPath |
18 |
0.000 |
4 |
0.004 |
|
|
|
|
|
|
|
|
|
|
|
| Thylakoid biogenesis and photosystem assembly |
BioPath |
18 |
0.000 |
2 |
0.001 |
|
|
|
|
|
|
|
|
|
|
|
| carotene biosynthesis |
TAIR-GO |
18 |
0.000 |
2 |
0.000 |
|
|
|
|
|
|
|
|
|
|
|
| carotenoid biosynthesis |
TAIR-GO |
18 |
0.000 |
2 |
0.002 |
|
|
|
|
|
|
|
|
|
|
|
| phenylalanine degradation I |
AraCyc |
18 |
0.000 |
4 |
0.000 |
|
|
|
|
|
|
|
|
|
|
|
| tyrosine degradation |
AraCyc |
18 |
0.000 |
4 |
0.000 |
|
|
|
|
|
|
|
|
|
|
|
| xanthophyll cycle |
AraCyc |
18 |
0.000 |
2 |
0.000 |
|
|
|
|
|
|
|
|
|
|
|
|
|
|
|
|
|
|
|
|
|
|
|
|
|
|
|
|
|
|
|
|
|
|
|
|
|
|
|
|
|
|
|
|
|
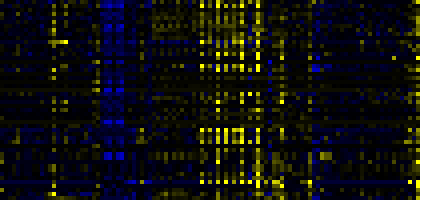
| Pathways co-expressed in the Hormone etc. data set (with more than 10 annotation points) |
|
CYP89A2 (At1g64900) |
|
|
|
|
|
|
|
|
| max. difference between log2-ratios: |
4.2 |
|
|
|
|
|
|
|
|
|
|
|
|
| max. difference between log2-ratios excluding lowest and highest 5%: |
2.0 |
|
|
|
|
|
|
|
|
|
|
|
|
| Pathway |
Source |
Scores of Genes |
p[Score] |
No. of Genes |
p[genes] |
Link to hormones etc. heatmap |
|
|
|
|
|
|
|
| Phenylpropanoid Metabolism |
BioPath |
40 |
0.000 |
4 |
0.009 |
|
|
|
|
|
|
| Glutathione metabolism |
KEGG |
32 |
0.000 |
5 |
0.000 |
|
|
|
|
|
| Glucosyltransferases for benzoic acids |
BioPath |
30 |
0.000 |
3 |
0.000 |
|
|
|
|
|
| toxin catabolism |
TAIR-GO |
30 |
0.000 |
7 |
0.000 |
|
|
|
|
|
| Biosynthesis of Amino Acids and Derivatives |
BioPath |
28 |
0.000 |
4 |
0.008 |
|
|
|
|
|
| Glutathione metabolism |
BioPath |
28 |
0.000 |
4 |
0.000 |
|
|
|
|
|
| Tryptophan metabolism |
KEGG |
17 |
0.000 |
2 |
0.005 |
|
|
|
|
|
| lignin biosynthesis |
AraCyc |
16 |
0.000 |
4 |
0.000 |
|
|
|
|
|
| stress response |
FunCat |
16 |
0.000 |
2 |
0.000 |
|
|
|
|
|
| Phenylpropanoid pathway |
LitPath |
16 |
0.000 |
4 |
0.001 |
|
|
|
|
|
| phenylalanine degradation I |
AraCyc |
12 |
0.000 |
2 |
0.001 |
|
|
|
|
|
| tyrosine degradation |
AraCyc |
12 |
0.000 |
2 |
0.000 |
|
|
|
|
|
| Stilbene, coumarine and lignin biosynthesis |
KEGG |
12 |
0.001 |
2 |
0.085 |
|
|
|
|
|
| detoxification |
FunCat |
11 |
0.000 |
3 |
0.000 |
|
|
|
|
|
|
|
|
|
|
|
| nitrogen and sulfur utilization |
FunCat |
11 |
0.000 |
2 |
0.000 |
|
|
|
|
|
|
|
|
|
|
|
| Cyanoamino acid metabolism |
KEGG |
11 |
0.000 |
2 |
0.002 |
|
|
|
|
|
|
|
|
|
|
|
|
|
|
|
|
|
|
|
|
|
|
|
|
|
|
|
|