|
|
|
|
|
|
|
|
|
|
|
|
|
|
|
|
|
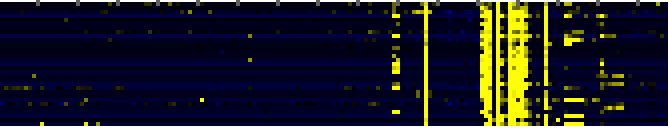
| Pathways co-expressed in the Organ and Tissue data set (with more than 6 annotation points) |
|
CYP89A3 (At5g61320) |
|
|
|
|
|
|
|
|
| max. difference between log2-ratios: |
3.6 |
|
|
|
|
|
|
|
|
|
|
|
|
| max. difference between log2-ratios excluding lowest and highest 5%: |
1.5 |
|
|
|
|
|
|
|
|
|
|
|
|
| Pathway |
Source |
Scores of Genes |
p[Score] |
No. of Genes |
p[genes] |
Link to organ heatmap |
|
|
|
|
|
|
|
| Miscellaneous acyl lipid metabolism |
AcylLipid |
36 |
0.000 |
12 |
0.000 |
|
|
|
|
|
|
|
|
|
|
|
| sexual reproduction |
TAIR-GO |
20 |
0.000 |
5 |
0.000 |
|
|
|
| Biosynthesis of prenyl diphosphates |
BioPath |
14 |
0.000 |
3 |
0.000 |
|
|
| Isoprenoid Biosynthesis in the Cytosol and in Mitochondria |
BioPath |
14 |
0.000 |
3 |
0.000 |
|
|
| prenyl diphosphate (GPP,FPP, GGPP) biosynthesis |
LitPath |
10 |
0.000 |
1 |
0.004 |
|
|
| triacylglycerol degradation |
AraCyc |
8 |
0.000 |
3 |
0.000 |
|
|
|
|
|
|
|
|
|
|
|
|
|
|
|
|
|
|
|
|
|
|
|
|
|
|
|
|
|
|
|
|
|
|
|
|
|
|
|
|
|
|
|
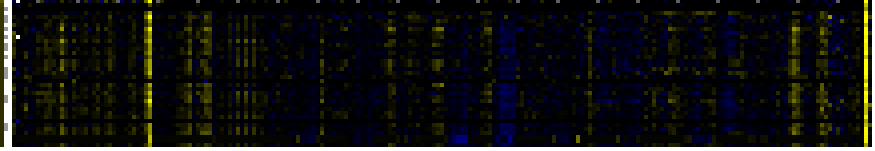
| Pathways co-expressed in the Stress data set ( with more than 6 annotation points) |
|
CYP89A3 (At5g61320) |
|
|
|
|
|
|
|
|
| max. difference between log2-ratios: |
5.9 |
|
|
|
|
|
|
|
|
|
|
|
|
| max. difference between log2-ratios excluding lowest and highest 5%: |
1.0 |
|
|
|
|
|
|
|
|
|
|
|
|
| Pathway |
Source |
Scores of Genes |
p[Score] |
No. of Genes |
p[genes] |
Link to stress heatmap |
|
|
|
|
|
|
|
| Folding, Sorting and Degradation |
KEGG |
150 |
0.000 |
29 |
0.000 |
|
| Proteasome |
KEGG |
150 |
0.000 |
29 |
0.000 |
| protein catabolism |
TAIR-GO |
128 |
0.000 |
23 |
0.000 |
| ubiquitin-dependent protein catabolism |
TAIR-GO |
128 |
0.000 |
23 |
0.000 |
| proteasome core complex (sensu Eukaryota) |
TAIR-GO |
72 |
0.000 |
12 |
0.000 |
| proteasome regulatory particle, base subcomplex (sensu Eukaryota) |
TAIR-GO |
38 |
0.000 |
6 |
0.000 |
| Benzoate degradation via CoA ligation |
KEGG |
18 |
0.000 |
2 |
0.197 |
| Inositol phosphate metabolism |
KEGG |
18 |
0.000 |
2 |
0.233 |
| Nicotinate and nicotinamide metabolism |
KEGG |
18 |
0.000 |
2 |
0.166 |
| cytoplasmic and nuclear protein degradation |
FunCat |
13 |
0.000 |
2 |
0.000 |
|
|
|
|
|
|
|
|
|
|
|
| N-terminal protein myristoylation |
TAIR-GO |
9 |
0.000 |
1 |
0.055 |
|
|
|
|
|
|
|
|
|
|
|
| phosphorylation |
TAIR-GO |
9 |
0.000 |
1 |
0.000 |
|
|
|
|
|
|
|
|
|
|
|
| protein amino acid phosphorylation |
TAIR-GO |
9 |
0.000 |
1 |
0.011 |
|
|
|
|
|
|
|
|
|
|
|
| calmodulin binding |
TAIR-GO |
7 |
0.001 |
1 |
0.074 |
|
|
|
|
|
|
|
|
|
|
|
|
|
|
|
|
|
|
|
|
|
|
|
|
|
|
|
|
|
|
|
|
|
|
|
|
|
|
|
|
|
|
|
|
|
|
|
|
|
|
|
|
|
|
|
|
|
|
|
|
|
|
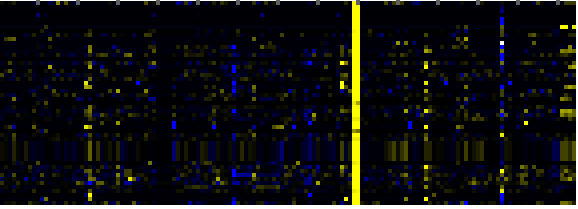
| Pathways co-expressed in the Mutant data set (with more than 10 annotation points) |
|
CYP89A3 (At5g61320) |
|
|
|
|
|
|
|
|
| max. difference between log2-ratios: |
7.0 |
|
|
|
|
|
|
|
|
|
|
|
|
| max. difference between log2-ratios excluding lowest and highest 5%: |
1.4 |
|
|
|
|
|
|
|
|
|
|
|
|
| Pathway |
Source |
Scores of Genes |
p[Score] |
No. of Genes |
p[genes] |
Link to mutants heatmap |
|
|
|
|
|
|
|
| Phenylpropanoid Metabolism |
BioPath |
78 |
0.000 |
12 |
0.000 |
|
|
|
|
| Aromatic amino acid (Phe, Tyr, Trp) metabolism |
BioPath |
52 |
0.000 |
8 |
0.000 |
|
|
|
| Shikimate pathway |
LitPath |
52 |
0.000 |
8 |
0.000 |
|
|
|
| tryptophan biosynthesis |
TAIR-GO |
48 |
0.000 |
7 |
0.000 |
|
|
|
| tryptophan biosynthesis |
AraCyc |
48 |
0.000 |
7 |
0.000 |
|
|
|
| Trp biosyntesis |
LitPath |
48 |
0.000 |
7 |
0.000 |
|
|
|
| Phenylpropanoid pathway |
LitPath |
46 |
0.000 |
8 |
0.014 |
|
|
|
| Biosynthesis of Amino Acids and Derivatives |
BioPath |
38 |
0.001 |
5 |
0.161 |
|
|
|
| response to pathogenic bacteria |
TAIR-GO |
38 |
0.000 |
6 |
0.000 |
|
|
|
| lignin biosynthesis |
AraCyc |
30 |
0.000 |
5 |
0.000 |
|
|
|
| core phenylpropanoid metabolism |
BioPath |
26 |
0.000 |
4 |
0.003 |
|
|
|
| Methionin/SAM/ethylene metabolism from cysteine and aspartate |
BioPath |
26 |
0.000 |
3 |
0.004 |
|
|
|
| biosynthesis of proto- and siroheme |
AraCyc |
24 |
0.000 |
3 |
0.007 |
|
|
|
| biogenesis of chloroplast |
FunCat |
24 |
0.000 |
3 |
0.029 |
|
|
|
| Lipid signaling |
AcylLipid |
24 |
0.002 |
9 |
0.012 |
|
|
|
|
|
|
|
|
|
|
|
| Benzoate degradation via CoA ligation |
KEGG |
23 |
0.000 |
8 |
0.000 |
|
|
|
|
|
|
|
|
|
|
|
| Inositol phosphate metabolism |
KEGG |
23 |
0.000 |
8 |
0.001 |
|
|
|
|
|
|
|
|
|
|
|
| Nicotinate and nicotinamide metabolism |
KEGG |
23 |
0.000 |
8 |
0.000 |
|
|
|
|
|
|
|
|
|
|
|
| Phenylalanine, tyrosine and tryptophan biosynthesis |
KEGG |
22 |
0.000 |
3 |
0.024 |
|
|
|
|
|
|
|
|
|
|
|
| Propanoate metabolism |
KEGG |
22 |
0.000 |
3 |
0.007 |
|
|
|
|
|
|
|
|
|
|
|
| Chlorophyll biosynthesis and breakdown |
BioPath |
20 |
0.000 |
2 |
0.036 |
|
|
|
|
|
|
|
|
|
|
|
| Porphyrin and chlorophyll metabolism |
KEGG |
20 |
0.000 |
2 |
0.031 |
|
|
|
|
|
|
|
|
|
|
|
| chlorophyll and phytochromobilin metabolism |
LitPath |
20 |
0.041 |
2 |
0.238 |
|
|
|
|
|
|
|
|
|
|
|
| Nucleotide sugars metabolism |
KEGG |
18 |
0.000 |
5 |
0.000 |
|
|
|
|
|
|
|
|
|
|
|
| ethylene biosynthesis |
TAIR-GO |
16 |
0.000 |
2 |
0.000 |
|
|
|
|
|
|
|
|
|
|
|
| C-compound and carbohydrate utilization |
FunCat |
16 |
0.000 |
3 |
0.000 |
|
|
|
|
|
|
|
|
|
|
|
| secondary metabolism |
FunCat |
16 |
0.000 |
3 |
0.027 |
|
|
|
|
|
|
|
|
|
|
|
| Synthesis of membrane lipids in endomembrane system |
AcylLipid |
16 |
0.000 |
3 |
0.120 |
|
|
|
|
|
|
|
|
|
|
|
| chlorophyll biosynthesis |
AraCyc |
14 |
0.000 |
2 |
0.073 |
|
|
|
|
|
|
|
|
|
|
|
| fructose degradation (anaerobic) |
AraCyc |
14 |
0.000 |
3 |
0.030 |
|
|
|
|
|
|
|
|
|
|
|
| sorbitol fermentation |
AraCyc |
14 |
0.001 |
3 |
0.034 |
|
|
|
|
|
|
|
|
|
|
|
| Stilbene, coumarine and lignin biosynthesis |
KEGG |
13 |
0.023 |
3 |
0.249 |
|
|
|
|
|
|
|
|
|
|
|
| toxin catabolism |
TAIR-GO |
12 |
0.000 |
6 |
0.000 |
|
|
|
|
|
|
|
|
|
|
|
| flavonoid biosynthesis |
AraCyc |
12 |
0.000 |
2 |
0.013 |
|
|
|
|
|
|
|
|
|
|
|
| Alanine and aspartate metabolism |
KEGG |
12 |
0.000 |
2 |
0.044 |
|
|
|
|
|
|
|
|
|
|
|
| beta-Alanine metabolism |
KEGG |
12 |
0.000 |
2 |
0.014 |
|
|
|
|
|
|
|
|
|
|
|
| Butanoate metabolism |
KEGG |
12 |
0.000 |
2 |
0.025 |
|
|
|
|
|
|
|
|
|
|
|
| Cysteine metabolism |
KEGG |
12 |
0.000 |
3 |
0.005 |
|
|
|
|
|
|
|
|
|
|
|
| Glutamate metabolism |
KEGG |
12 |
0.011 |
2 |
0.097 |
|
|
|
|
|
|
|
|
|
|
|
| Taurine and hypotaurine metabolism |
KEGG |
12 |
0.000 |
2 |
0.000 |
|
|
|
|
|
|
|
|
|
|
|
| defense response |
TAIR-GO |
11 |
0.000 |
2 |
0.007 |
|
|
|
|
|
|
|
|
|
|
|
|
|
|
|
|
|
|
|
|
|
|
|
|
|
|
|
|