|
|
|
|
|
|
|
|
|
|
|
|
|
|
|
|
|
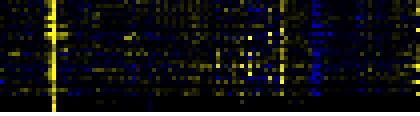
| Pathways co-expressed in the Stress data set ( with more than 6 annotation points) |
|
CYP94B3 (At3g48520) |
|
|
|
|
|
|
|
|
| max. difference between log2-ratios: |
8.6 |
|
|
|
|
|
|
|
|
|
|
|
|
| max. difference between log2-ratios excluding lowest and highest 5%: |
4.9 |
|
|
|
|
|
|
|
|
|
|
|
|
| Pathway |
Source |
Scores of Genes |
p[Score] |
No. of Genes |
p[genes] |
Link to stress heatmap |
|
|
|
|
|
|
|
| Cell Wall Carbohydrate Metabolism |
BioPath |
18 |
0.000 |
2 |
0.030 |

|
| cellulose biosynthesis |
BioPath |
18 |
0.000 |
2 |
0.000 |
| cellulose biosynthesis |
AraCyc |
18 |
0.000 |
2 |
0.000 |
| biogenesis of cell wall |
FunCat |
12 |
0.000 |
2 |
0.001 |
| detoxification |
FunCat |
10 |
0.000 |
1 |
0.000 |
| detoxification involving cytochrome P450 |
FunCat |
10 |
0.000 |
1 |
0.000 |
|
|
|
|
|
|
|
|
|
|
|
| degradation of abscisic acid |
LitPath |
10 |
0.000 |
1 |
0.000 |
|
|
|
|
|
|
|
|
|
|
|
| gibberellic acid catabolism |
TAIR-GO |
9 |
0.000 |
1 |
0.000 |
|
|
|
|
|
|
|
|
|
|
|
| C-compound, carbohydrate anabolism |
FunCat |
8 |
0.000 |
1 |
0.001 |
|
|
|
|
|
|
|
|
|
|
|
| Lipid signaling |
AcylLipid |
8 |
0.000 |
2 |
0.050 |
|
|
|
|
|
|
|
|
|
|
|
|
|
|
|
|
|
|
|
|
|
|
|
|
|
|
|
|
|
|
|
|
|
|
|
|
|
|
|
|
|
|
|
|
|
| Pathways co-expressed in the Hormone etc. data set (with more than 7 annotation points) |
|
CYP94B3 (At3g48520) |
|
|
|
|
|
|
|
|
| max. difference between log2-ratios: |
3.9 |
|
|
|
|
|
|
|
|
|
|
|
|
| max. difference between log2-ratios excluding lowest and highest 5%: |
1.6 |
|
|
|
|
|
|
|
|
|
|
|
|
| Pathway |
Source |
Scores of Genes |
p[Score] |
No. of Genes |
p[genes] |
Link to hormones etc. heatmap |
|
|
|
|
|
|
|
| degradation of abscisic acid |
LitPath |
20 |
0.000 |
2 |
0.000 |
|
|
|
|
|
|
| Phenylpropanoid Metabolism |
BioPath |
18 |
0.000 |
2 |
0.030 |
|
|
|
|
|
| Cell Wall Carbohydrate Metabolism |
BioPath |
16 |
0.001 |
3 |
0.040 |
|
|
|
|
|
| Miscellaneous acyl lipid metabolism |
AcylLipid |
16 |
0.000 |
4 |
0.017 |
|
|
|
|
|
| biogenesis of cell wall |
FunCat |
14 |
0.000 |
2 |
0.015 |
|
|
|
|
|
| core phenylpropanoid metabolism |
BioPath |
10 |
0.000 |
1 |
0.014 |
|
|
|
|
|
| Gluconeogenesis from lipids in seeds |
BioPath |
10 |
0.000 |
1 |
0.031 |
|
|
|
|
|
| cell death |
TAIR-GO |
10 |
0.000 |
1 |
0.001 |
|
|
|
|
|
|
|
|
|
|
|
| fatty acid alpha-oxidation |
TAIR-GO |
10 |
0.000 |
1 |
0.000 |
|
|
|
|
|
|
|
|
|
|
|
| lignin biosynthesis |
TAIR-GO |
10 |
0.000 |
1 |
0.004 |
|
|
|
|
|
|
|
|
|
|
|
| fatty acid oxidation pathway |
AraCyc |
10 |
0.000 |
1 |
0.017 |
|
|
|
|
|
|
|
|
|
|
|
| jasmonic acid biosynthesis |
AraCyc |
10 |
0.000 |
1 |
0.016 |
|
|
|
|
|
|
|
|
|
|
|
| lignin biosynthesis |
AraCyc |
10 |
0.000 |
1 |
0.081 |
|
|
|
|
|
|
|
|
|
|
|
| lipoxygenase pathway |
AraCyc |
10 |
0.000 |
1 |
0.007 |
|
|
|
|
|
|
|
|
|
|
|
| octane oxidation |
AraCyc |
10 |
0.000 |
1 |
0.005 |
|
|
|
|
|
|
|
|
|
|
|
| detoxification |
FunCat |
10 |
0.000 |
1 |
0.000 |
|
|
|
|
|
|
|
|
|
|
|
| detoxification involving cytochrome P450 |
FunCat |
10 |
0.000 |
1 |
0.004 |
|
|
|
|
|
|
|
|
|
|
|
| Fatty acid metabolism |
KEGG |
10 |
0.000 |
1 |
0.005 |
|
|
|
|
|
|
|
|
|
|
|
| Galactose metabolism |
KEGG |
10 |
0.000 |
3 |
0.000 |
|
|
|
|
|
|
|
|
|
|
|
| Stilbene, coumarine and lignin biosynthesis |
KEGG |
10 |
0.000 |
1 |
0.036 |
|
|
|
|
|
|
|
|
|
|
|
| Phenylpropanoid pathway |
LitPath |
10 |
0.001 |
1 |
0.106 |
|
|
|
|
|
|
|
|
|
|
|
| gibberellic acid catabolism |
TAIR-GO |
9 |
0.000 |
1 |
0.001 |
|
|
|
|
|
|
|
|
|
|
|
| response to abscisic acid stimulus |
TAIR-GO |
9 |
0.000 |
2 |
0.000 |
|
|
|
|
|
|
|
|
|
|
|
| ascorbic acid biosynthesis |
BioPath |
8 |
0.000 |
1 |
0.003 |
|
|
|
|
|
|
|
|
|
|
|
| Flavonoid and anthocyanin metabolism |
BioPath |
8 |
0.000 |
1 |
0.021 |
|
|
|
|
|
|
|
|
|
|
|
| flavonoid biosynthesis |
TAIR-GO |
8 |
0.000 |
1 |
0.002 |
|
|
|
|
|
|
|
|
|
|
|
| ascorbate glutathione cycle |
AraCyc |
8 |
0.000 |
1 |
0.012 |
|
|
|
|
|
|
|
|
|
|
|
| C-compound, carbohydrate anabolism |
FunCat |
8 |
0.000 |
2 |
0.000 |
|
|
|
|
|
|
|
|
|
|
|
| mRNA synthesis |
FunCat |
8 |
0.000 |
1 |
0.021 |
|
|
|
|
|
|
|
|
|
|
|
| RNA synthesis |
FunCat |
8 |
0.000 |
1 |
0.021 |
|
|
|
|
|
|
|
|
|
|
|
| transcription |
FunCat |
8 |
0.000 |
1 |
0.006 |
|
|
|
|
|
|
|
|
|
|
|
| transcriptional control |
FunCat |
8 |
0.000 |
1 |
0.004 |
|
|
|
|
|
|
|
|
|
|
|
| Ascorbate and aldarate metabolism |
KEGG |
8 |
0.000 |
1 |
0.003 |
|
|
|
|
|
|
|
|
|
|
|
|
|
|
|
|
|
|
|
|
|
|
|
|
|
|
|
|