| _________________________________________ |
|
|
|
|
|
|
|
|
|
|
|
|
|
|
|
|
| Pathways co-expressed in the 3 data sets with co-expressed pathways (with more than 6 annotation points each) |
|
Find below a list of pathways that are co-expressed with the bait. First a list of pathways is given that are co-expressed in all data sets. Lists for each individual dataset are shown underneath. Depending on the number of co-expressed pathways only the top scoring pathways are given; all data can be saved as text using the link above. |

|
|
|
|
|
|
|
|
| Pathway |
Source |
Sum of scores |
Sum of genes |
|
|
|
|
|
|
|
|
| jasmonic acid biosynthesis |
TAIR-GO |
180 |
26 |
|
|
|
|
|
|
|
|
| jasmonic acid biosynthesis |
TAIR-GO |
180 |
26 |
|
|
|
|
|
|
|
|
| Lipid signaling |
AcylLipid |
116 |
21 |
|
|
|
|
|
|
|
|
| response to wounding |
TAIR-GO |
96 |
13 |
|
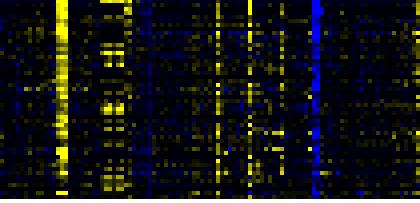
To the right of each table a thumbnail of the actual co-expression heatmap is given. Klick on the link to see the heatmap containing all co-expressed genes. |
|
|
|
|
|
|
|
|
|
| lipoxygenase pathway |
AraCyc |
60 |
10 |
|
|
|
|
|
|
|
|
|
|
|
|
|
|
|
|
|
|
|
|
|
|
|
|
|
|
|
|
|
For more information on how these pathway maps were generated please read the methods page |
|
|
|
|
|
|
|
|
|
|
|
|
|
|
|
|
|
|
|
|
|
|
|
|
|
|
|
|
|
|
|
|
|
|
|
|
|
|
|
|
|
|
|
|
|
|
|
|
|
|
|
|
|
|
|
|
|
| Pathways co-expressed in the Hormone etc. data set (with more than 19 annotation points) |
|
CYP94C1 (At2g27690) |
|
|
|
|
|
|
|
|
| max. difference between log2-ratios: |
11.1 |
|
|
|
|
|
|
|
|
|
|
|
|
| max. difference between log2-ratios excluding lowest and highest 5%: |
3.2 |
|
|
|
|
|
|
|
|
|
|
|
|
| Pathway |
Source |
Scores of Genes |
p[Score] |
No. of Genes |
p[genes] |
Link to hormones etc. heatmap |
|
|
|
|
|
|
|
| Phenylpropanoid Metabolism |
BioPath |
86 |
0.000 |
12 |
0.000 |
|
|
|
|
|
|
| tryptophan biosynthesis |
TAIR-GO |
68 |
0.000 |
9 |
0.000 |
|
|
|
|
|
| Shikimate pathway |
LitPath |
68 |
0.000 |
9 |
0.000 |
|
|
|
|
|
| Aromatic amino acid (Phe, Tyr, Trp) metabolism |
BioPath |
62 |
0.000 |
8 |
0.000 |
|
|
|
|
|
| Biosynthesis of Amino Acids and Derivatives |
BioPath |
62 |
0.000 |
7 |
0.013 |
|
|
|
|
|
| tryptophan biosynthesis |
AraCyc |
60 |
0.000 |
9 |
0.000 |
|
|
|
|
|
| Phenylalanine, tyrosine and tryptophan biosynthesis |
KEGG |
58 |
0.000 |
7 |
0.000 |
|
|
|
|
|
| Trp biosyntesis |
LitPath |
58 |
0.000 |
8 |
0.000 |
|
|
|
|
|
| Glutathione metabolism |
BioPath |
56 |
0.000 |
6 |
0.000 |
|
|
|
|
|
| Glucosinolate Metabolism |
LitPath |
50 |
0.000 |
5 |
0.000 |
|
|
|
|
|
| response to pathogenic bacteria |
TAIR-GO |
48 |
0.000 |
7 |
0.000 |
|
|
|
|
|
| response to wounding |
TAIR-GO |
46 |
0.000 |
6 |
0.000 |
|
|
|
|
|
| jasmonic acid biosynthesis |
TAIR-GO |
42 |
0.000 |
6 |
0.000 |
|
|
|
|
|
|
|
|
|
|
|
| jasmonic acid biosynthesis |
AraCyc |
42 |
0.000 |
6 |
0.000 |
|
|
|
|
|
|
|
|
|
|
|
| Lipid signaling |
AcylLipid |
42 |
0.000 |
6 |
0.007 |
|
|
|
|
|
|
|
|
|
|
|
| sulfate assimilation III |
AraCyc |
36 |
0.000 |
4 |
0.000 |
|
|
|
|
|
|
|
|
|
|
|
| lipoxygenase pathway |
AraCyc |
32 |
0.000 |
5 |
0.000 |
|
|
|
|
|
|
|
|
|
|
|
| Purine metabolism |
KEGG |
32 |
0.000 |
4 |
0.000 |
|
|
|
|
|
|
|
|
|
|
|
| Selenoamino acid metabolism |
KEGG |
30 |
0.000 |
3 |
0.000 |
|
|
|
|
|
|
|
|
|
|
|
| Sulfur metabolism |
KEGG |
30 |
0.000 |
3 |
0.000 |
|
|
|
|
|
|
|
|
|
|
|
| alanine biosynthesis II |
AraCyc |
26 |
0.000 |
3 |
0.001 |
|
|
|
|
|
|
|
|
|
|
|
| dissimilatory sulfate reduction |
AraCyc |
26 |
0.000 |
3 |
0.000 |
|
|
|
|
|
|
|
|
|
|
|
| phenylalanine biosynthesis II |
AraCyc |
26 |
0.000 |
3 |
0.001 |
|
|
|
|
|
|
|
|
|
|
|
| Isoprenoid Biosynthesis in the Cytosol and in Mitochondria |
BioPath |
20 |
0.011 |
2 |
0.119 |
|
|
|
|
|
|
|
|
|
|
|
| indoleacetic acid biosynthesis |
TAIR-GO |
20 |
0.000 |
2 |
0.000 |
|
|
|
|
|
|
|
|
|
|
|
| sulfate assimilation |
TAIR-GO |
20 |
0.000 |
2 |
0.002 |
|
|
|
|
|
|
|
|
|
|
|
| glucosinolate biosynthesis from phenylalanine |
AraCyc |
20 |
0.000 |
2 |
0.000 |
|
|
|
|
|
|
|
|
|
|
|
| glucosinolate biosynthesis from tryptophan |
AraCyc |
20 |
0.000 |
2 |
0.000 |
|
|
|
|
|
|
|
|
|
|
|
| nitrogen and sulfur utilization |
FunCat |
20 |
0.000 |
2 |
0.000 |
|
|
|
|
|
|
|
|
|
|
|
| gamma-Hexachlorocyclohexane degradation |
KEGG |
20 |
0.000 |
2 |
0.001 |
|
|
|
|
|
|
|
|
|
|
|
|
|
|
|
|
|
|
|
|
|
|
|
|
|
|
|
|
|
|
|
|
|
|
|
|
|
|
|
|
|
|
|
|
|
|
|
|
|
|
|
|
|
|
|
|
|
|
|
|
|
|
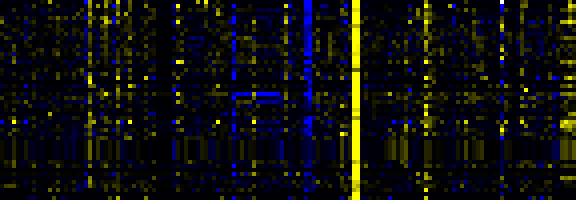
| Pathways co-expressed in the Mutant data set (with more than 10 annotation points) |
|
CYP94C1 (At2g27690) |
|
|
|
|
|
|
|
|
| max. difference between log2-ratios: |
10.3 |
|
|
|
|
|
|
|
|
|
|
|
|
| max. difference between log2-ratios excluding lowest and highest 5%: |
1.8 |
|
|
|
|
|
|
|
|
|
|
|
|
| Pathway |
Source |
Scores of Genes |
p[Score] |
No. of Genes |
p[genes] |
Link to mutants heatmap |
|
|
|
|
|
|
|
| Phenylpropanoid Metabolism |
BioPath |
74 |
0.000 |
10 |
0.000 |
|
|
|
|
| Shikimate pathway |
LitPath |
58 |
0.000 |
8 |
0.000 |
|
|
|
| tryptophan biosynthesis |
TAIR-GO |
54 |
0.000 |
7 |
0.000 |
|
|
|
| tryptophan biosynthesis |
AraCyc |
54 |
0.000 |
7 |
0.000 |
|
|
|
| Trp biosyntesis |
LitPath |
54 |
0.000 |
7 |
0.000 |
|
|
|
| Aromatic amino acid (Phe, Tyr, Trp) metabolism |
BioPath |
52 |
0.000 |
7 |
0.000 |
|
|
|
| Lipid signaling |
AcylLipid |
50 |
0.000 |
11 |
0.001 |
|
|
|
| response to pathogenic bacteria |
TAIR-GO |
44 |
0.000 |
6 |
0.000 |
|
|
|
| Phenylpropanoid pathway |
LitPath |
40 |
0.000 |
6 |
0.034 |
|
|
|
| response to wounding |
TAIR-GO |
34 |
0.000 |
5 |
0.000 |
|
|
|
| Phenylalanine, tyrosine and tryptophan biosynthesis |
KEGG |
32 |
0.000 |
4 |
0.001 |
|
|
|
| Benzoate degradation via CoA ligation |
KEGG |
29 |
0.000 |
10 |
0.000 |
|
|
|
| Inositol phosphate metabolism |
KEGG |
29 |
0.000 |
10 |
0.000 |
|
|
|
|
|
|
|
|
|
|
|
| Nicotinate and nicotinamide metabolism |
KEGG |
29 |
0.000 |
10 |
0.000 |
|
|
|
|
|
|
|
|
|
|
|
| lignin biosynthesis |
AraCyc |
28 |
0.000 |
4 |
0.000 |
|
|
|
|
|
|
|
|
|
|
|
| jasmonic acid biosynthesis |
TAIR-GO |
26 |
0.000 |
4 |
0.000 |
|
|
|
|
|
|
|
|
|
|
|
| jasmonic acid biosynthesis |
AraCyc |
26 |
0.000 |
4 |
0.000 |
|
|
|
|
|
|
|
|
|
|
|
| core phenylpropanoid metabolism |
BioPath |
22 |
0.000 |
3 |
0.009 |
|
|
|
|
|
|
|
|
|
|
|
| Chlorophyll biosynthesis and breakdown |
BioPath |
20 |
0.000 |
2 |
0.022 |
|
|
|
|
|
|
|
|
|
|
|
| biosynthesis of proto- and siroheme |
AraCyc |
20 |
0.000 |
2 |
0.016 |
|
|
|
|
|
|
|
|
|
|
|
| biogenesis of chloroplast |
FunCat |
20 |
0.000 |
2 |
0.028 |
|
|
|
|
|
|
|
|
|
|
|
| Porphyrin and chlorophyll metabolism |
KEGG |
20 |
0.000 |
2 |
0.012 |
|
|
|
|
|
|
|
|
|
|
|
| chlorophyll and phytochromobilin metabolism |
LitPath |
20 |
0.020 |
2 |
0.150 |
|
|
|
|
|
|
|
|
|
|
|
| gibberellic acid catabolism |
TAIR-GO |
19 |
0.000 |
2 |
0.000 |
|
|
|
|
|
|
|
|
|
|
|
| Glycerolipid metabolism |
KEGG |
18 |
0.000 |
2 |
0.021 |
|
|
|
|
|
|
|
|
|
|
|
| defense response |
TAIR-GO |
17 |
0.000 |
3 |
0.001 |
|
|
|
|
|
|
|
|
|
|
|
| lipoxygenase pathway |
AraCyc |
16 |
0.000 |
3 |
0.000 |
|
|
|
|
|
|
|
|
|
|
|
| intracellular signalling |
FunCat |
16 |
0.000 |
4 |
0.000 |
|
|
|
|
|
|
|
|
|
|
|
| Glycan Biosynthesis and Metabolism |
KEGG |
16 |
0.000 |
5 |
0.001 |
|
|
|
|
|
|
|
|
|
|
|
| Purine metabolism |
KEGG |
16 |
0.000 |
2 |
0.092 |
|
|
|
|
|
|
|
|
|
|
|
| nucleotide metabolism |
TAIR-GO |
15 |
0.000 |
2 |
0.000 |
|
|
|
|
|
|
|
|
|
|
|
| de novo biosynthesis of purine nucleotides I |
AraCyc |
15 |
0.000 |
2 |
0.103 |
|
|
|
|
|
|
|
|
|
|
|
| Leaf Glycerolipid Biosynthesis in cytosol / ER |
BioPath |
14 |
0.000 |
2 |
0.017 |
|
|
|
|
|
|
|
|
|
|
|
| triacylglycerol degradation |
AraCyc |
14 |
0.000 |
3 |
0.005 |
|
|
|
|
|
|
|
|
|
|
|
| secondary metabolism |
FunCat |
14 |
0.000 |
2 |
0.027 |
|
|
|
|
|
|
|
|
|
|
|
| cellulose biosynthesis |
BioPath |
12 |
0.004 |
2 |
0.049 |
|
|
|
|
|
|
|
|
|
|
|
| flavonoid biosynthesis |
AraCyc |
12 |
0.000 |
2 |
0.005 |
|
|
|
|
|
|
|
|
|
|
|
| phospholipid biosynthesis II |
AraCyc |
12 |
0.000 |
2 |
0.003 |
|
|
|
|
|
|
|
|
|
|
|
|
|
|
|
|
|
|
|
|
|
|
|
|
|
|
|
|
