| _________________________________________ |
|
|
|
|
|
|
|
|
|
|
|
|
|
|
|
|
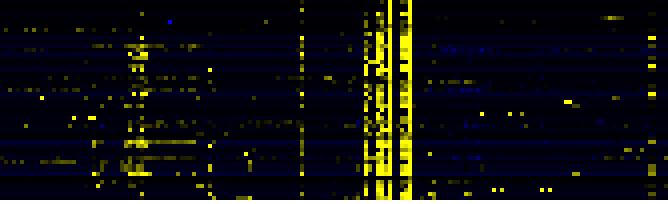
| Pathways co-expressed in the 2 data sets with co-expressed genes (with more than 6 annotation points each) |
|
Find below a list of pathways that are co-expressed with the bait. First a list of pathways is given that are co-expressed in all data sets. Lists for each individual dataset are shown underneath. Depending on the number of co-expressed pathways only the top scoring pathways are given; all data can be saved as text using the link above. |

|
|
|
|
|
|
|
|
| Pathway |
Source |
Sum of scores |
Sum of genes |
|
|
|
|
|
|
|
|
| Cell Wall Carbohydrate Metabolism |
BioPath |
60 |
15 |
|
|
|
|
|
|
|
|
| pectin metabolism |
BioPath |
40 |
12 |
|
|
|
|
|
|
|
|
| Phenylpropanoid Metabolism |
BioPath |
33 |
5 |
|
|
|
|
|
|
|
|
| Glucosyltransferases for benzoic acids |
BioPath |
30 |
3 |
|
To the right of each table a thumbnail of the actual co-expression heatmap is given. Klick on the link to see the heatmap containing all co-expressed genes. |
|
|
|
|
|
|
|
|
|
| Biosynthesis of steroids |
KEGG |
23 |
5 |
|
|
|
|
|
|
|
|
|
|
| Stilbene, coumarine and lignin biosynthesis |
KEGG |
22 |
11 |
|
|
|
|
|
|
|
|
|
|
| C-compound and carbohydrate utilization |
FunCat |
21 |
3 |
|
For more information on how these pathway maps were generated please read the methods page |
|
|
|
|
|
|
|
|
|
| Methane metabolism |
KEGG |
20 |
10 |
|
|
|
|
|
|
|
|
|
|
| Phenylalanine metabolism |
KEGG |
20 |
10 |
|
|
|
|
|
|
|
|
|
|
|
|
|
| Prostaglandin and leukotriene metabolism |
KEGG |
20 |
10 |
|
|
|
|
|
|
|
|
|
|
|
|
|
| Terpenoid biosynthesis |
KEGG |
16 |
4 |
|
|
|
|
|
|
|
|
|
|
|
|
|
|
|
|
|
|
|
|
|
|
|
|
|
|
|
|
|
|
|
|
|
|
|
|
|
|
|
|
|
|
|
|
|
|
|
| Pathways co-expressed in the Organ and Tissue data set (with more than 10 annotation points) |
|
CYP94D1 (At1g34540) |
|
|
|
|
|
|
|
|
| max. difference between log2-ratios: |
4.7 |
|
|
|
|
|
|
|
|
|
|
|
|
| max. difference between log2-ratios excluding lowest and highest 5%: |
0.0 |
|
|
|
|
|
|
|
|
|
|
|
|
| Pathway |
Source |
Scores of Genes |
p[Score] |
No. of Genes |
p[genes] |
Link to organ heatmap |
|
|
|
|
|
|
|
| Cell Wall Carbohydrate Metabolism |
BioPath |
43 |
0.000 |
9 |
0.016 |
|
|
|
|
|
|
|
|
|
|
|
| pectin metabolism |
BioPath |
23 |
0.000 |
6 |
0.004 |
|
|
|
| secondary metabolism |
FunCat |
22 |
0.000 |
4 |
0.001 |
|
|
| triterpene, sterol, and brassinosteroid metabolism |
LitPath |
22 |
0.000 |
5 |
0.002 |
|
|
| Phenylpropanoid Metabolism |
BioPath |
21 |
0.011 |
3 |
0.230 |
|
|
| cellulose biosynthesis |
BioPath |
20 |
0.000 |
3 |
0.004 |
|
|
| Glucosyltransferases for benzoic acids |
BioPath |
20 |
0.000 |
2 |
0.001 |
|
|
| hemicellulose biosynthesis |
BioPath |
16 |
0.000 |
2 |
0.001 |
|
|
| Fructose and mannose metabolism |
KEGG |
16 |
0.000 |
2 |
0.021 |
|
|
| Glycan Biosynthesis and Metabolism |
KEGG |
16 |
0.000 |
2 |
0.046 |
|
|
| Glycerolipid metabolism |
KEGG |
16 |
0.000 |
2 |
0.008 |
|
|
| Biosynthesis of steroids |
KEGG |
15 |
0.000 |
3 |
0.003 |
|
|
| Biosynthesis of prenyl diphosphates |
BioPath |
14 |
0.000 |
2 |
0.024 |
|
|
| Plastidial Isoprenoids (Chlorophylls, Carotenoids, Tocopherols, Plastoquinone, Phylloquinone) |
BioPath |
14 |
0.028 |
2 |
0.114 |
|
|
|
|
|
|
|
|
|
|
|
| pentacyclic triterpenoid biosynthesis |
TAIR-GO |
14 |
0.000 |
2 |
0.000 |
|
|
|
|
|
|
|
|
|
|
|
| prenyl diphosphate (GPP,FPP, GGPP) biosynthesis |
LitPath |
14 |
0.000 |
2 |
0.003 |
|
|
|
|
|
|
|
|
|
|
|
| triterpene biosynthesis |
LitPath |
14 |
0.000 |
2 |
0.001 |
|
|
|
|
|
|
|
|
|
|
|
| flavonol biosynthesis |
AraCyc |
12 |
0.000 |
3 |
0.000 |
|
|
|
|
|
|
|
|
|
|
|
| nucleotide metabolism |
FunCat |
12 |
0.000 |
2 |
0.000 |
|
|
|
|
|
|
|
|
|
|
|
| purine nucleotide metabolism |
FunCat |
12 |
0.000 |
2 |
0.002 |
|
|
|
|
|
|
|
|
|
|
|
| C-compound and carbohydrate utilization |
FunCat |
11 |
0.000 |
2 |
0.000 |
|
|
|
|
|
|
|
|
|
|
|
| Phosphatidylinositol signaling system |
KEGG |
11 |
0.000 |
2 |
0.009 |
|
|
|
|
|
|
|
|
|
|
|
| Signal Transduction |
KEGG |
11 |
0.000 |
2 |
0.010 |
|
|
|
|
|
|
|
|
|
|
|
|
|
|
|
|
|
|
|
|
|
|
|
|
|
|
|
|
|
|
|
|
|
|
|
|
|
|
|
|
|
|
|
|
|
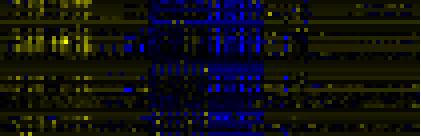
| Pathways co-expressed in the Hormone etc. data set (with more than 6 annotation points) |
|
CYP94D1 (At1g34540) |
|
|
|
|
|
|
|
|
| max. difference between log2-ratios: |
3.5 |
|
|
|
|
|
|
|
|
|
|
|
|
| max. difference between log2-ratios excluding lowest and highest 5%: |
2.5 |
|
|
|
|
|
|
|
|
|
|
|
|
| Pathway |
Source |
Scores of Genes |
p[Score] |
No. of Genes |
p[genes] |
Link to hormones etc. heatmap |
|
|
|
|
|
|
|
| Cell Wall Carbohydrate Metabolism |
BioPath |
16.5 |
0.021 |
6 |
0.037 |
|
|
|
|
|
|
| pectin metabolism |
BioPath |
16.5 |
0.000 |
6 |
0.000 |
|
|
|
|
|
| Oxidative phosphorylation |
KEGG |
16 |
0.000 |
3 |
0.007 |
|
|
|
|
|
| Phenylpropanoid Metabolism |
BioPath |
12 |
0.014 |
2 |
0.236 |
|
|
|
|
|
| Stilbene, coumarine and lignin biosynthesis |
KEGG |
12 |
0.000 |
6 |
0.000 |
|
|
|
|
|
| Glucosyltransferases for benzoic acids |
BioPath |
10 |
0.000 |
1 |
0.007 |
|
|
|
|
|
| C-compound and carbohydrate utilization |
FunCat |
10 |
0.000 |
1 |
0.000 |
|
|
|
|
|
| Methane metabolism |
KEGG |
10 |
0.000 |
5 |
0.000 |
|
|
|
|
|
| Phenylalanine metabolism |
KEGG |
10 |
0.000 |
5 |
0.000 |
|
|
|
|
|
| Prostaglandin and leukotriene metabolism |
KEGG |
10 |
0.000 |
5 |
0.000 |
|
|
|
|
|
|
|
|
|
|
|
| signal transduction |
TAIR-GO |
9 |
0.000 |
1 |
0.000 |
|
|
|
|
|
|
|
|
|
|
|
| Benzoate degradation via CoA ligation |
KEGG |
9 |
0.000 |
1 |
0.249 |
|
|
|
|
|
|
|
|
|
|
|
| Inositol phosphate metabolism |
KEGG |
9 |
0.001 |
1 |
0.282 |
|
|
|
|
|
|
|
|
|
|
|
| Nicotinate and nicotinamide metabolism |
KEGG |
9 |
0.000 |
1 |
0.221 |
|
|
|
|
|
|
|
|
|
|
|
| biogenesis of cell wall |
FunCat |
8 |
0.000 |
2 |
0.002 |
|
|
|
|
|
|
|
|
|
|
|
| C-compound and carbohydrate metabolism |
FunCat |
8 |
0.013 |
2 |
0.090 |
|
|
|
|
|
|
|
|
|
|
|
| Basal transcription factors |
KEGG |
8 |
0.000 |
2 |
0.006 |
|
|
|
|
|
|
|
|
|
|
|
| Biosynthesis of steroids |
KEGG |
8 |
0.001 |
2 |
0.013 |
|
|
|
|
|
|
|
|
|
|
|
| Terpenoid biosynthesis |
KEGG |
8 |
0.000 |
2 |
0.002 |
|
|
|
|
|
|
|
|
|
|
|
| Transcription |
KEGG |
8 |
0.000 |
2 |
0.049 |
|
|
|
|
|
|
|
|
|
|
|
|
|
|
|
|
|
|
|
|
|
|
|
|
|
|
|
|