|
|
|
|
|
|
|
|
|
|
|
|
|
|
|
|
|
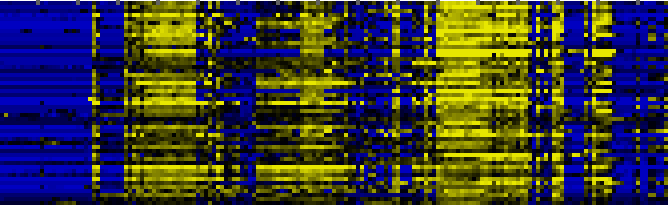
| Pathways co-expressed in the Organ and Tissue data set (with more than 12 annotation points) |
|
CYP96A12 (At4g39510) |
|
|
|
|
|
|
|
|
| max. difference between log2-ratios: |
5.0 |
|
|
|
|
|
|
|
|
|
|
|
|
| max. difference between log2-ratios excluding lowest and highest 5%: |
4.1 |
|
|
|
|
|
|
|
|
|
|
|
|
| Pathway |
Source |
Scores of Genes |
p[Score] |
No. of Genes |
p[genes] |
Link to organ heatmap |
|
|
|
|
|
|
|
| Plastidial Isoprenoids (Chlorophylls, Carotenoids, Tocopherols, Plastoquinone, Phylloquinone) |
BioPath |
45 |
0.000 |
7 |
0.002 |
|
|
|
|
|
|
|
|
|
|
|
| Miscellaneous acyl lipid metabolism |
AcylLipid |
44 |
0.000 |
11 |
0.000 |
|
|
|
| C-compound and carbohydrate metabolism |
FunCat |
42 |
0.001 |
6 |
0.080 |
|
|
| Photosystems |
BioPath |
38 |
0.000 |
5 |
0.081 |
|
|
| Gluconeogenesis from lipids in seeds |
BioPath |
32 |
0.000 |
4 |
0.043 |
|
|
| additional photosystem II components |
BioPath |
26 |
0.000 |
3 |
0.024 |
|
|
| Chlorophyll biosynthesis and breakdown |
BioPath |
23 |
0.000 |
4 |
0.002 |
|
|
| Flavonoid and anthocyanin metabolism |
BioPath |
23 |
0.000 |
4 |
0.019 |
|
|
| flavonoid biosynthesis |
AraCyc |
22 |
0.000 |
3 |
0.001 |
|
|
| Pentose phosphate pathway |
KEGG |
22 |
0.000 |
3 |
0.001 |
|
|
| Flavonoid biosynthesis |
KEGG |
21 |
0.000 |
3 |
0.000 |
|
|
| flavonoid biosynthesis |
TAIR-GO |
20 |
0.000 |
2 |
0.001 |
|
|
| pentose-phosphate shunt |
TAIR-GO |
20 |
0.000 |
2 |
0.003 |
|
|
| fatty acid oxidation pathway |
AraCyc |
20 |
0.000 |
2 |
0.003 |
|
|
| octane oxidation |
AraCyc |
20 |
0.000 |
2 |
0.000 |
|
|
|
|
|
|
|
|
|
|
|
| biosynthesis of phenylpropanoids |
FunCat |
20 |
0.000 |
2 |
0.012 |
|
|
|
|
|
|
|
|
|
|
|
| biosynthesis of secondary products derived from L-phenylalanine and L-tyrosine |
FunCat |
20 |
0.000 |
2 |
0.012 |
|
|
|
|
|
|
|
|
|
|
|
| energy |
FunCat |
20 |
0.000 |
2 |
0.000 |
|
|
|
|
|
|
|
|
|
|
|
| metabolism of energy reserves (e.g. glycogen, trehalose) |
FunCat |
20 |
0.000 |
2 |
0.000 |
|
|
|
|
|
|
|
|
|
|
|
| pentose-phosphate pathway |
FunCat |
20 |
0.000 |
2 |
0.003 |
|
|
|
|
|
|
|
|
|
|
|
| flavonoid, anthocyanin, and proanthocyanidin biosynthesis |
LitPath |
20 |
0.000 |
2 |
0.002 |
|
|
|
|
|
|
|
|
|
|
|
| proanthocyanidin biosynthesis |
LitPath |
20 |
0.000 |
2 |
0.002 |
|
|
|
|
|
|
|
|
|
|
|
| secondary metabolism |
FunCat |
19 |
0.000 |
2 |
0.054 |
|
|
|
|
|
|
|
|
|
|
|
| glycolysis and gluconeogenesis |
FunCat |
18 |
0.048 |
3 |
0.086 |
|
|
|
|
|
|
|
|
|
|
|
| Photosynthesis |
KEGG |
18 |
0.000 |
2 |
0.004 |
|
|
|
|
|
|
|
|
|
|
|
| chloroplast thylakoid membrane protein import |
TAIR-GO |
17 |
0.000 |
2 |
0.000 |
|
|
|
|
|
|
|
|
|
|
|
| Porphyrin and chlorophyll metabolism |
KEGG |
17 |
0.000 |
3 |
0.000 |
|
|
|
|
|
|
|
|
|
|
|
| chlorophyll and phytochromobilin metabolism |
LitPath |
17 |
0.000 |
3 |
0.007 |
|
|
|
|
|
|
|
|
|
|
|
| Chlorophyll a/b binding proteins |
BioPath |
16 |
0.000 |
2 |
0.016 |
|
|
|
|
|
|
|
|
|
|
|
| photosystem II type II chlorophyll a /b binding protein |
BioPath |
16 |
0.000 |
2 |
0.000 |
|
|
|
|
|
|
|
|
|
|
|
| fatty acid biosynthesis |
TAIR-GO |
16 |
0.000 |
2 |
0.006 |
|
|
|
|
|
|
|
|
|
|
|
| photosynthesis |
FunCat |
16 |
0.000 |
2 |
0.025 |
|
|
|
|
|
|
|
|
|
|
|
| chlorophyll biosynthesis |
TAIR-GO |
15 |
0.000 |
2 |
0.005 |
|
|
|
|
|
|
|
|
|
|
|
| acetate fermentation |
AraCyc |
14 |
0.000 |
3 |
0.023 |
|
|
|
|
|
|
|
|
|
|
|
| chlorophyll biosynthesis |
AraCyc |
14 |
0.000 |
3 |
0.009 |
|
|
|
|
|
|
|
|
|
|
|
|
|
|
|
|
|
|
|
|
|
|
|
|
|
|
|
|
|
|
|
|
|
|
|
|
|
|
|
|
|
|
|
|
|
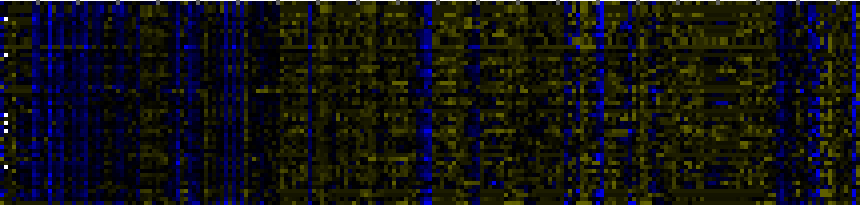
| Pathways co-expressed in the Stress data set ( with more than 18 annotation points) |
|
CYP96A12 (At4g39510) |
|
|
|
|
|
|
|
|
| max. difference between log2-ratios: |
3.8 |
|
|
|
|
|
|
|
|
|
|
|
|
| max. difference between log2-ratios excluding lowest and highest 5%: |
2.0 |
|
|
|
|
|
|
|
|
|
|
|
|
| Pathway |
Source |
Scores of Genes |
p[Score] |
No. of Genes |
p[genes] |
Link to stress heatmap |
|
|
|
|
|
|
|
| Plastidial Isoprenoids (Chlorophylls, Carotenoids, Tocopherols, Plastoquinone, Phylloquinone) |
BioPath |
77 |
0.000 |
10 |
0.000 |
|
|
|
|
|
|
|
|
|
|
|
| C-compound and carbohydrate metabolism |
FunCat |
76 |
0.000 |
13 |
0.003 |
|
|
|
|
|
|
|
|
|
|
|
| Intermediary Carbon Metabolism |
BioPath |
46 |
0.000 |
6 |
0.209 |
|
| Biosynthesis of steroids |
KEGG |
34 |
0.000 |
4 |
0.001 |
| Carotenoid and abscisic acid metabolism |
LitPath |
32 |
0.000 |
4 |
0.001 |
| Photosystems |
BioPath |
30 |
0.017 |
5 |
0.107 |
| Glycolysis / Gluconeogenesis |
KEGG |
30 |
0.000 |
4 |
0.008 |
| chlorophyll biosynthesis |
TAIR-GO |
29 |
0.000 |
3 |
0.000 |
| chlorophyll biosynthesis |
LitPath |
29 |
0.000 |
3 |
0.000 |
| Carotenoid biosynthesis |
BioPath |
28 |
0.000 |
3 |
0.000 |
| carotenoid biosynthesis |
AraCyc |
28 |
0.000 |
3 |
0.000 |
| glycolysis and gluconeogenesis |
FunCat |
28 |
0.000 |
5 |
0.057 |
| photosynthesis |
FunCat |
28 |
0.000 |
4 |
0.003 |
| carotenid biosynthesis |
LitPath |
28 |
0.000 |
3 |
0.001 |
| regulation of transcription |
TAIR-GO |
27 |
0.000 |
3 |
0.000 |
| energy |
FunCat |
26 |
0.000 |
3 |
0.000 |
|
|
|
|
|
|
|
|
|
|
|
| metabolism of energy reserves (e.g. glycogen, trehalose) |
FunCat |
26 |
0.000 |
3 |
0.000 |
|
|
|
|
|
|
|
|
|
|
|
| pentose-phosphate pathway |
FunCat |
26 |
0.000 |
3 |
0.001 |
|
|
|
|
|
|
|
|
|
|
|
| Pentose phosphate pathway |
KEGG |
26 |
0.000 |
3 |
0.004 |
|
|
|
|
|
|
|
|
|
|
|
| mRNA processing in chloroplast |
BioPath |
24 |
0.000 |
5 |
0.000 |
|
|
|
|
|
|
|
|
|
|
|
| Transcriptional regulators (chloroplast) |
BioPath |
20 |
0.000 |
2 |
0.000 |
|
|
|
|
|
|
|
|
|
|
|
| carotene biosynthesis |
TAIR-GO |
20 |
0.000 |
2 |
0.000 |
|
|
|
|
|
|
|
|
|
|
|
| pentose-phosphate shunt |
TAIR-GO |
20 |
0.000 |
2 |
0.003 |
|
|
|
|
|
|
|
|
|
|
|
| positive regulation of transcription |
TAIR-GO |
20 |
0.000 |
2 |
0.000 |
|
|
|
|
|
|
|
|
|
|
|
| secondary metabolism |
FunCat |
20 |
0.000 |
3 |
0.053 |
|
|
|
|
|
|
|
|
|
|
|
| Carbon fixation |
KEGG |
20 |
0.000 |
3 |
0.021 |
|
|
|
|
|
|
|
|
|
|
|
| Chlorophyll biosynthesis and breakdown |
BioPath |
19 |
0.000 |
2 |
0.080 |
|
|
|
|
|
|
|
|
|
|
|
| lipid, fatty acid and isoprenoid metabolism |
FunCat |
19 |
0.000 |
2 |
0.072 |
|
|
|
|
|
|
|
|
|
|
|
| chlorophyll and phytochromobilin metabolism |
LitPath |
19 |
0.011 |
2 |
0.162 |
|
|
|
|
|
|
|
|
|
|
|
|
|
|
|
|
|
|
|
|
|
|
|
|
|
|
|
|
|
|
|
|
|
|
|
|
|
|
|
|
|
|
|
|
|
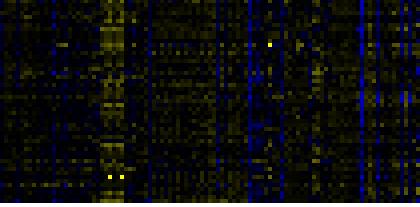
| Pathways co-expressed in the Hormone etc. data set (with more than 29 annotation points) |
|
CYP96A12 (At4g39510) |
|
|
|
|
|
|
|
|
| max. difference between log2-ratios: |
3.4 |
|
|
|
|
|
|
|
|
|
|
|
|
| max. difference between log2-ratios excluding lowest and highest 5%: |
1.7 |
|
|
|
|
|
|
|
|
|
|
|
|
| Pathway |
Source |
Scores of Genes |
p[Score] |
No. of Genes |
p[genes] |
Link to hormones etc. heatmap |
|
|
|
|
|
|
|
| Photosystems |
BioPath |
109 |
0.000 |
18 |
0.000 |
|
|
|
|
|
|
| C-compound and carbohydrate metabolism |
FunCat |
82 |
0.000 |
12 |
0.066 |
|
|
|
|
|
| Plastidial Isoprenoids (Chlorophylls, Carotenoids, Tocopherols, Plastoquinone, Phylloquinone) |
BioPath |
71 |
0.000 |
10 |
0.005 |
|
|
|
|
|
| Intermediary Carbon Metabolism |
BioPath |
62 |
0.008 |
10 |
0.236 |
|
|
|
|
|
| additional photosystem II components |
BioPath |
56 |
0.000 |
8 |
0.000 |
|
|
|
|
|
| Photosynthesis |
KEGG |
53 |
0.000 |
11 |
0.000 |
|
|
|
|
|
| Carbon fixation |
KEGG |
52 |
0.000 |
7 |
0.001 |
|
|
|
|
|
| photosynthesis |
FunCat |
50 |
0.000 |
7 |
0.000 |
|
|
|
|
|
| biogenesis of chloroplast |
FunCat |
47 |
0.000 |
7 |
0.001 |
|
|
|
|
|
| Leaf Glycerolipid Biosynthesis in Plastid |
BioPath |
45 |
0.000 |
6 |
0.034 |
|
|
|
|
|
| Chlorophyll biosynthesis and breakdown |
BioPath |
43 |
0.000 |
6 |
0.002 |
|
|
|
|
|
| chlorophyll biosynthesis |
AraCyc |
42 |
0.000 |
7 |
0.001 |
|
|
|
|
|
| glycosylglyceride desaturation pathway |
AraCyc |
37 |
0.000 |
4 |
0.000 |
|
|
|
|
|
| Nucleotide Metabolism |
KEGG |
37 |
0.000 |
6 |
0.010 |
|
|
|
|
|
|
|
|
|
|
|
| Porphyrin and chlorophyll metabolism |
KEGG |
37 |
0.000 |
5 |
0.000 |
|
|
|
|
|
|
|
|
|
|
|
| Synthesis of membrane lipids in plastids |
AcylLipid |
37 |
0.000 |
4 |
0.000 |
|
|
|
|
|
|
|
|
|
|
|
| chlorophyll and phytochromobilin metabolism |
LitPath |
37 |
0.000 |
5 |
0.001 |
|
|
|
|
|
|
|
|
|
|
|
| Photosystem I |
BioPath |
35 |
0.001 |
6 |
0.034 |
|
|
|
|
|
|
|
|
|
|
|
| chlorophyll biosynthesis |
TAIR-GO |
35 |
0.000 |
4 |
0.000 |
|
|
|
|
|
|
|
|
|
|
|
| tricarboxylic-acid pathway (citrate cycle, Krebs cycle, TCA cycle) |
FunCat |
32 |
0.001 |
4 |
0.210 |
|
|
|
|
|
|
|
|
|
|
|
| glycolysis and gluconeogenesis |
FunCat |
31 |
0.009 |
5 |
0.160 |
|
|
|
|
|
|
|
|
|
|
|
| Purine metabolism |
KEGG |
31 |
0.000 |
5 |
0.011 |
|
|
|
|
|
|
|
|
|
|
|
| phospholipid desaturation pathway |
AraCyc |
30 |
0.000 |
3 |
0.000 |
|
|
|
|
|
|
|
|
|
|
|
| 1,1,1-Trichloro-2,2-bis(4-chlorophenyl)ethane (DDT) degradatio |
KEGG |
30 |
0.000 |
3 |
0.000 |
|
|
|
|
|
|
|
|
|
|
|
| 1,1,1-Trichloro-2,2-bis(4-chlorophenyl)ethane (DDT) degradation |
KEGG |
30 |
0.000 |
3 |
0.000 |
|
|
|
|
|
|
|
|
|
|
|
| Androgen and estrogen metabolism |
KEGG |
30 |
0.000 |
3 |
0.000 |
|
|
|
|
|
|
|
|
|
|
|
| Benzoate degradation via hydroxylation |
KEGG |
30 |
0.000 |
3 |
0.000 |
|
|
|
|
|
|
|
|
|
|
|
| Glycolysis / Gluconeogenesis |
KEGG |
30 |
0.001 |
4 |
0.095 |
|
|
|
|
|
|
|
|
|
|
|
|
|
|
|
|
|
|
|
|
|
|
|
|
|
|
|
|
|
|
|
|
|
|
|
|
|
|
|
|
|
|
|
|
|
|
|
|
|
|
|
|
|
|
|
|
|
|
|
|
|
|
| Pathways co-expressed in the Mutant data set (with more than 10 annotation points) |
|
CYP96A12 (At4g39510) |
|
|
|
|
|
|
|
|
| max. difference between log2-ratios: |
3.1 |
|
|
|
|
|
|
|
|
|
|
|
|
| max. difference between log2-ratios excluding lowest and highest 5%: |
1.8 |
|
|
|
|
|
|
|
|
|
|
|
|
| Pathway |
Source |
Scores of Genes |
p[Score] |
No. of Genes |
p[genes] |
Link to mutants heatmap |
|
|
|
|
|
|
|
| Cell Wall Carbohydrate Metabolism |
BioPath |
12 |
0.000 |
2 |
0.030 |

|
|
|
|
| pectin metabolism |
BioPath |
12 |
0.000 |
2 |
0.003 |
|
|
|
| core phenylpropanoid metabolism |
BioPath |
10 |
0.000 |
1 |
0.004 |
|
|
|
| Phenylpropanoid Metabolism |
BioPath |
10 |
0.000 |
1 |
0.053 |
|
|
|
| biogenesis of cell wall |
FunCat |
10 |
0.000 |
1 |
0.006 |
|
|
|
|
|
|
|
|
|
|
|
| biosynthesis of phenylpropanoids |
FunCat |
10 |
0.000 |
1 |
0.002 |
|
|
|
|
|
|
|
|
|
|
|
| biosynthesis of secondary products derived from L-phenylalanine and L-tyrosine |
FunCat |
10 |
0.000 |
1 |
0.002 |
|
|
|
|
|
|
|
|
|
|
|
| Phenylpropanoid pathway |
LitPath |
10 |
0.000 |
1 |
0.000 |
|
|
|
|
|
|
|
|
|
|
|
| C-compound and carbohydrate metabolism |
FunCat |
8 |
0.010 |
1 |
0.085 |
|
|
|
|
|
|
|
|
|
|
|
| Ribosome |
KEGG |
8 |
0.000 |
2 |
0.000 |
|
|
|
|
|
|
|
|
|
|
|
|
|
|
|
|
|
|
|
|
|
|
|
|
|
|
|
|