
| Co-Expression Analysis of: | CYPedia Home | Institut de Biologie Moléculaire des Plantes (Home) | ||||||||||||||
| CYP96A13 (At5g02900) | save all data as Tab Delimited Table | |||||||||||||||
| _________________________________________ |
|
|||||||||||||||
| Pathways co-expressed in the 3 data sets with co-expressed pathways (with more than 6 annotation points each) | Find below a list of pathways that are co-expressed with the bait. First a list of pathways is given that are co-expressed in all data sets. Lists for each individual dataset are shown underneath. Depending on the number of co-expressed pathways only the top scoring pathways are given; all data can be saved as text using the link above. | |||||||||||||||
| Pathway | Source | Sum of scores | Sum of genes | |||||||||||||
| terpenoid metabolism | LitPath | 82 | 10 | |||||||||||||
| mono-/sesqui-/di-terpene biosynthesis | LitPath | 82 | 10 | |||||||||||||
| To the right of each table a thumbnail of the actual co-expression heatmap is given. Klick on the link to see the heatmap containing all co-expressed genes. | ||||||||||||||||
| For more information on how these pathway maps were generated please read the methods page | ||||||||||||||||
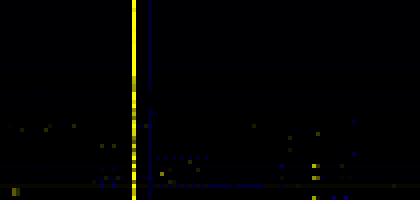
| Pathways co-expressed in the Organ and Tissue data set (with more than 6 annotation points) | CYP96A13 (At5g02900) | |||||||||||||||
| max. difference between log2-ratios: | 5.5 | |||||||||||||||
| max. difference between log2-ratios excluding lowest and highest 5%: | 3.0 | |||||||||||||||
| Pathway | Source | Scores of Genes | p[Score] | No. of Genes | p[genes] | Link to organ heatmap | ||||||||||
| mono-/sesqui-/di-terpene biosynthesis | LitPath | 28 | 0.000 | 4 | 0.000 |
|
||||||||||
| terpenoid metabolism | LitPath | 28 | 0.000 | 4 | 0.000 | |||||||||||
| gibberellic acid biosynthesis | TAIR-GO | 10 | 0.000 | 1 | 0.000 | |||||||||||
| gibberellin biosynthesis | AraCyc | 10 | 0.000 | 1 | 0.000 | |||||||||||
| Diterpenoid biosynthesis | KEGG | 10 | 0.000 | 1 | 0.000 | |||||||||||
| Gibberellin metabolism | LitPath | 10 | 0.000 | 1 | 0.028 | |||||||||||
| giberelin biosynthesis | LitPath | 10 | 0.000 | 1 | 0.017 | |||||||||||
| sequiterpene biosynthesis | LitPath | 10 | 0.000 | 1 | 0.000 | |||||||||||
| Miscellaneous acyl lipid metabolism | AcylLipid | 8 | 0.000 | 4 | 0.006 | |||||||||||
| Pathways co-expressed in the Stress data set ( with more than 6 annotation points) | CYP96A13 (At5g02900) | |||||||||||||||
| max. difference between log2-ratios: | 1.9 | |||||||||||||||
| max. difference between log2-ratios excluding lowest and highest 5%: | 0.0 | |||||||||||||||
| Link to stress heatmap | ||||||||||||||||
| there are no co-expressed genes with r>0.5 | ||||||||||||||||
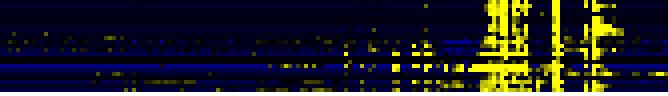
| Pathways co-expressed in the Hormone etc. data set (with more than 10 annotation points) | CYP96A13 (At5g02900) | |||||||||||||||
| max. difference between log2-ratios: | 3.9 | |||||||||||||||
| max. difference between log2-ratios excluding lowest and highest 5%: | 0.0 | |||||||||||||||
| Pathway | Source | Scores of Genes | p[Score] | No. of Genes | p[genes] | Link to hormones etc. heatmap | ||||||||||
| pectin metabolism | BioPath | 75 | 0.000 | 21 | 0.000 |
|
||||||||||
| mono-/sesqui-/di-terpene biosynthesis | LitPath | 54 | 0.000 | 6 | 0.000 | |||||||||||
| terpenoid metabolism | LitPath | 54 | 0.000 | 6 | 0.000 | |||||||||||
| Miscellaneous acyl lipid metabolism | AcylLipid | 48 | 0.000 | 18 | 0.000 | |||||||||||
| Starch and sucrose metabolism | KEGG | 42 | 0.000 | 6 | 0.000 | |||||||||||
| Phenylpropanoid Metabolism | BioPath | 24 | 0.010 | 4 | 0.322 | |||||||||||
| Phenylpropanoid pathway | LitPath | 24 | 0.016 | 4 | 0.117 | |||||||||||
| Fatty acid elongation and wax and cutin metabolism | AcylLipid | 23 | 0.000 | 7 | 0.012 | |||||||||||
| core phenylpropanoid metabolism | BioPath | 22 | 0.000 | 3 | 0.016 | |||||||||||
| sexual reproduction | TAIR-GO | 20 | 0.000 | 5 | 0.000 | |||||||||||
| monoterpene biosynthesis | LitPath | 20 | 0.000 | 2 | 0.000 | |||||||||||
| sucrose metabolism | BioPath | 16 | 0.000 | 2 | 0.008 | |||||||||||
| biogenesis of cell wall | FunCat | 16 | 0.000 | 7 | 0.000 | |||||||||||
| Galactose metabolism | KEGG | 16 | 0.000 | 2 | 0.004 | |||||||||||
| C-compound and carbohydrate utilization | FunCat | 14 | 0.000 | 2 | 0.000 | |||||||||||
| fatty acid metabolism | TAIR-GO | 13 | 0.000 | 2 | 0.002 | |||||||||||
| Oxidative phosphorylation | KEGG | 12 | 0.000 | 3 | 0.006 | |||||||||||
| Pathways co-expressed in the Mutant data set (with more than 6 annotation points) | CYP96A13 (At5g02900) | |||||||||||||||
| max. difference between log2-ratios: | 4.4 | |||||||||||||||
| max. difference between log2-ratios excluding lowest and highest 5%: | 0.3 | |||||||||||||||
| Link to mutants heatmap | ||||||||||||||||
| there are no co-expressed genes with more than 6 annotation points | ||||||||||||||||
| page created by Juergen Ehlting | 06/08/06 | |||||||||||||||