|
|
|
|
|
|
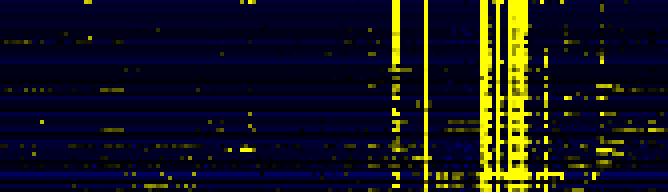
| Pathways co-expressed in the Hormone etc. data set (with more than 6 annotation points) |
|
CYP96A2 (At4g32170) |
|
|
|
|
|
|
|
|
| max. difference between log2-ratios: |
3.9 |
|
|
|
|
|
|
|
|
|
|
|
|
| max. difference between log2-ratios excluding lowest and highest 5%: |
0.0 |
|
|
|
|
|
|
|
|
|
|
|
|
| Pathway |
Source |
Scores of Genes |
p[Score] |
No. of Genes |
p[genes] |
Link to hormones etc. heatmap |
|
|
|
|
|
|
|
| Cell Wall Carbohydrate Metabolism |
BioPath |
97 |
0.000 |
25 |
0.000 |
|
|
|
|
|
|
| pectin metabolism |
BioPath |
75 |
0.000 |
21 |
0.000 |
|
|
|
|
|
| mono-/sesqui-/di-terpene biosynthesis |
LitPath |
54 |
0.000 |
6 |
0.000 |
|
|
|
|
|
| terpenoid metabolism |
LitPath |
54 |
0.000 |
6 |
0.000 |
|
|
|
|
|
| Miscellaneous acyl lipid metabolism |
AcylLipid |
48 |
0.000 |
18 |
0.000 |
|
|
|
|
|
| Starch and sucrose metabolism |
KEGG |
42 |
0.000 |
6 |
0.000 |
|
|
|
|
|
| Phenylpropanoid Metabolism |
BioPath |
24 |
0.010 |
4 |
0.322 |
|
|
|
|
|
| Phenylpropanoid pathway |
LitPath |
24 |
0.016 |
4 |
0.117 |
|
|
|
|
|
| Fatty acid elongation and wax and cutin metabolism |
AcylLipid |
23 |
0.000 |
7 |
0.012 |
|
|
|
|
|
| core phenylpropanoid metabolism |
BioPath |
22 |
0.000 |
3 |
0.016 |
|
|
|
|
|
| sexual reproduction |
TAIR-GO |
20 |
0.000 |
5 |
0.000 |
|
|
|
|
|
| monoterpene biosynthesis |
LitPath |
20 |
0.000 |
2 |
0.000 |
|
|
|
|
|
| sucrose metabolism |
BioPath |
16 |
0.000 |
2 |
0.008 |
|
|
|
|
|
|
|
|
|
|
|
| biogenesis of cell wall |
FunCat |
16 |
0.000 |
7 |
0.000 |
|
|
|
|
|
|
|
|
|
|
|
| Galactose metabolism |
KEGG |
16 |
0.000 |
2 |
0.004 |
|
|
|
|
|
|
|
|
|
|
|
| C-compound and carbohydrate utilization |
FunCat |
14 |
0.000 |
2 |
0.000 |
|
|
|
|
|
|
|
|
|
|
|
| fatty acid metabolism |
TAIR-GO |
13 |
0.000 |
2 |
0.002 |
|
|
|
|
|
|
|
|
|
|
|
| Oxidative phosphorylation |
KEGG |
12 |
0.000 |
3 |
0.006 |
|
|
|
|
|
|
|
|
|
|
|
| jasmonic acid biosynthesis |
TAIR-GO |
10 |
0.000 |
1 |
0.018 |
|
|
|
|
|
|
|
|
|
|
|
| jasmonic acid mediated signaling pathway |
TAIR-GO |
10 |
0.000 |
1 |
0.000 |
|
|
|
|
|
|
|
|
|
|
|
| jasmonic acid metabolism |
TAIR-GO |
10 |
0.000 |
1 |
0.000 |
|
|
|
|
|
|
|
|
|
|
|
| monoterpenoid biosynthesis |
TAIR-GO |
10 |
0.000 |
1 |
0.001 |
|
|
|
|
|
|
|
|
|
|
|
| N-terminal protein myristoylation |
TAIR-GO |
10 |
0.000 |
1 |
0.006 |
|
|
|
|
|
|
|
|
|
|
|
| pentacyclic triterpenoid biosynthesis |
TAIR-GO |
10 |
0.000 |
1 |
0.003 |
|
|
|
|
|
|
|
|
|
|
|
| response to wounding |
TAIR-GO |
10 |
0.000 |
1 |
0.024 |
|
|
|
|
|
|
|
|
|
|
|
| jasmonic acid biosynthesis |
AraCyc |
10 |
0.000 |
1 |
0.004 |
|
|
|
|
|
|
|
|
|
|
|
| monoterpene biosynthesis |
AraCyc |
10 |
0.000 |
1 |
0.000 |
|
|
|
|
|
|
|
|
|
|
|
| plant monoterpene biosynthesis |
AraCyc |
10 |
0.000 |
1 |
0.000 |
|
|
|
|
|
|
|
|
|
|
|
| C-compound, carbohydrate catabolism |
FunCat |
10 |
0.000 |
3 |
0.005 |
|
|
|
|
|
|
|
|
|
|
|
| Biosynthesis of steroids |
KEGG |
10 |
0.000 |
1 |
0.080 |
|
|
|
|
|
|
|
|
|
|
|
| sequiterpene biosynthesis |
LitPath |
10 |
0.000 |
1 |
0.001 |
|
|
|
|
|
|
|
|
|
|
|
| triterpene biosynthesis |
LitPath |
10 |
0.000 |
1 |
0.042 |
|
|
|
|
|
|
|
|
|
|
|
| cellulose biosynthesis |
AraCyc |
8 |
0.000 |
2 |
0.002 |
|
|
|
|
|
|
|
|
|
|
|
| lactose degradation IV |
AraCyc |
8 |
0.000 |
2 |
0.000 |
|
|
|
|
|
|
|
|
|
|
|
| transport |
FunCat |
8 |
0.000 |
3 |
0.000 |
|
|
|
|
|
|
|
|
|
|
|
| Pentose and glucuronate interconversions |
KEGG |
8 |
0.000 |
2 |
0.000 |
|
|
|
|
|
|
|
|
|
|
|
|
|
|
|
|
|
|
|
|
|
|
|
|
|
|
|
|
|
|
|
|
|
|
|
|
|
|
|
|
|
|
|
|
|
|
|
|
|
|
|
|
|
|
|
|
|
|
|
|
|
|
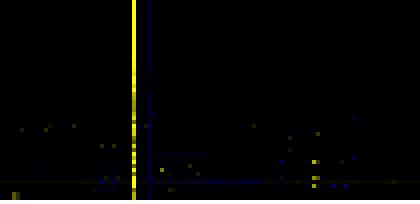
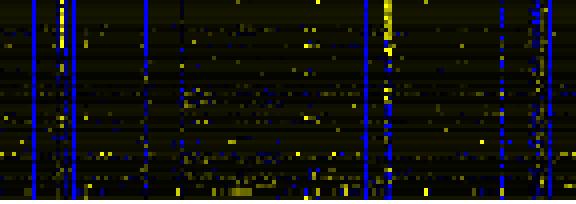
| Pathways co-expressed in the Mutant data set (with more than 8 annotation points) |
|
CYP96A2 (At4g32170) |
|
|
|
|
|
|
|
|
| max. difference between log2-ratios: |
10.8 |
|
|
|
|
|
|
|
|
|
|
|
|
| max. difference between log2-ratios excluding lowest and highest 5%: |
1.2 |
|
|
|
|
|
|
|
|
|
|
|
|
| Pathway |
Source |
Scores of Genes |
p[Score] |
No. of Genes |
p[genes] |
Link to mutants heatmap |
|
|
|
|
|
|
|
| Phenylpropanoid Metabolism |
BioPath |
43 |
0.000 |
10 |
0.000 |
|
|
|
|
| Cell Wall Carbohydrate Metabolism |
BioPath |
34 |
0.000 |
8 |
0.083 |
|
|
|
| Phenylpropanoid pathway |
LitPath |
33 |
0.000 |
8 |
0.000 |
|
|
|
| Miscellaneous acyl lipid metabolism |
AcylLipid |
32 |
0.000 |
15 |
0.000 |
|
|
|
| core phenylpropanoid metabolism |
BioPath |
26 |
0.000 |
5 |
0.000 |
|
|
|
| Ribosome |
KEGG |
24 |
0.000 |
4 |
0.059 |
|
|
|
| C-compound and carbohydrate metabolism |
FunCat |
22 |
0.010 |
6 |
0.105 |
|
|
|
| pectin metabolism |
BioPath |
20 |
0.000 |
6 |
0.009 |
|
|
|
| Glycan Biosynthesis and Metabolism |
KEGG |
18 |
0.000 |
2 |
0.016 |
|
|
|
| Fatty acid elongation and wax and cutin metabolism |
AcylLipid |
17 |
0.000 |
7 |
0.003 |
|
|
|
| protein synthesis |
FunCat |
12 |
0.018 |
2 |
0.302 |
|
|
|
| lignin biosynthesis |
AraCyc |
11 |
0.000 |
5 |
0.000 |
|
|
|
| Glutamate/glutamine from nitrogen fixation |
BioPath |
10 |
0.000 |
1 |
0.018 |
|
|
|
|
|
|
|
|
|
|
|
| salycilic acid biosynthesis |
BioPath |
10 |
0.000 |
1 |
0.002 |
|
|
|
|
|
|
|
|
|
|
|
| ammonia assimilation cycle |
AraCyc |
10 |
0.000 |
1 |
0.005 |
|
|
|
|
|
|
|
|
|
|
|
| glutamine biosynthesis I |
AraCyc |
10 |
0.000 |
1 |
0.003 |
|
|
|
|
|
|
|
|
|
|
|
| nitrate assimilation pathway |
AraCyc |
10 |
0.000 |
1 |
0.006 |
|
|
|
|
|
|
|
|
|
|
|
| assimilation of ammonia, metabolism of the glutamate group |
FunCat |
10 |
0.000 |
1 |
0.041 |
|
|
|
|
|
|
|
|
|
|
|
| biogenesis of cell wall |
FunCat |
10 |
0.000 |
3 |
0.016 |
|
|
|
|
|
|
|
|
|
|
|
| nitrogen and sulfur metabolism |
FunCat |
10 |
0.000 |
1 |
0.037 |
|
|
|
|
|
|
|
|
|
|
|
| Glutamate metabolism |
KEGG |
10 |
0.000 |
1 |
0.051 |
|
|
|
|
|
|
|
|
|
|
|
| Nitrogen metabolism |
KEGG |
10 |
0.000 |
1 |
0.029 |
|
|
|
|
|
|
|
|
|
|
|
| Peptidoglycan biosynthesis |
KEGG |
10 |
0.000 |
1 |
0.001 |
|
|
|
|
|
|
|
|
|
|
|
| Starch and sucrose metabolism |
KEGG |
10 |
0.001 |
2 |
0.025 |
|
|
|
|
|
|
|
|
|
|
|
|
|
|
|
|
|
|
|
|
|
|
|
|
|
|
|
|