| _________________________________________ |
|
|
|
|
|
|
|
|
|
|
|
|
|
|
|
|
|
| Pathways co-expressed in all 4 data sets (with more than 6 annotation points each) |
|
Find below a list of pathways that are co-expressed with the bait. First a list of pathways is given that are co-expressed in all data sets. Lists for each individual dataset are shown underneath. Depending on the number of co-expressed pathways only the top scoring pathways are given; all data can be saved as text using the link above. |

|
|
|
|
|
|
|
|
|
| Pathway |
Source |
Sum of scores |
Sum of genes |
|
|
|
|
|
|
|
|
|
| jasmonic acid biosynthesis |
TAIR-GO |
154 |
20 |
|
|
|
|
|
|
|
|
|
| jasmonic acid biosynthesis |
AraCyc |
154 |
20 |
|
|
|
|
|
|
|
|
|
| Lipid signaling |
AcylLipid |
114 |
15 |
|
|
|
|
|
|
|
|
|
| lipoxygenase pathway |
AraCyc |
82 |
11 |
|
To the right of each table a thumbnail of the actual co-expression heatmap is given. Klick on the link to see the heatmap containing all co-expressed genes. |
|
|
|
|
|
|
|
|
|
|
| oxylipin pathway |
LitPath |
50 |
5 |
|
|
|
|
|
|
|
|
|
|
|
|
|
|
|
|
|
|
|
|
|
|
|
|
|
|
|
|
|
|
|
For more information on how these pathway maps were generated please read the methods page |
|
|
|
|
|
|
|
|
|
|
|
|
|
|
|
|
|
|
|
|
|
|
|
|
|
|
|
|
|
|
|
|
|
|
|
|
|
|
|
|
|
|
|
|
|
|
|
|
|
|
|
|
|
|
|
|
|
|
|
|
|
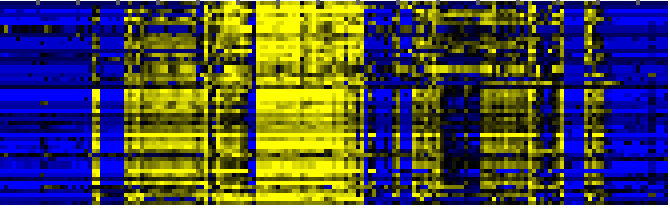
| Pathways co-expressed in the Organ and Tissue data set (with more than 6 annotation points) |
|
CYP96A4 (At5g52320) |
|
|
|
|
|
|
|
|
|
| max. difference between log2-ratios: |
3.5 |
|
|
|
|
|
|
|
|
|
|
|
|
|
| max. difference between log2-ratios excluding lowest and highest 5%: |
5.0 |
|
|
|
|
|
|
|
|
|
|
|
|
|
| Pathway |
Source |
Scores of Genes |
p[Score] |
No. of Genes |
p[genes] |
Link to organ heatmap |
|
|
|
|
|
|
|
|
| Carbon fixation |
KEGG |
35 |
0.000 |
5 |
|
|
|
|
|
| C-compound and carbohydrate metabolism |
FunCat |
34 |
0.000 |
7 |
|
|
|
|
| biogenesis of chloroplast |
FunCat |
28 |
0.000 |
4 |
|
|
|
|
| Intermediary Carbon Metabolism |
BioPath |
26 |
0.000 |
4 |
|
|
|
|
| Plastidial Isoprenoids (Chlorophylls, Carotenoids, Tocopherols, Plastoquinone, Phylloquinone) |
BioPath |
26 |
0.000 |
3 |
|
|
|
|
| jasmonic acid biosynthesis |
TAIR-GO |
26 |
0.000 |
3 |
|
|
|
|
| response to wounding |
TAIR-GO |
26 |
0.000 |
3 |
|
|
|
|
| jasmonic acid biosynthesis |
AraCyc |
26 |
0.000 |
3 |
|
|
|
|
| Lipid signaling |
AcylLipid |
26 |
0.000 |
3 |
|
|
|
|
| starch metabolism |
BioPath |
22 |
0.000 |
3 |
|
|
|
|
| glycine biosynthesis I |
AraCyc |
21 |
0.000 |
6 |
|
|
|
|
| photorespiration |
AraCyc |
21 |
0.000 |
6 |
|
|
|
|
| superpathway of serine and glycine biosynthesis II |
AraCyc |
21 |
0.000 |
6 |
|
|
|
|
| Chlorophyll biosynthesis and breakdown |
BioPath |
20 |
0.000 |
2 |
|
|
|
|
|
|
|
|
|
|
|
|
|
| Calvin cycle |
AraCyc |
20 |
0.000 |
3 |
|
|
|
|
|
|
|
|
|
|
|
|
|
| gluconeogenesis |
AraCyc |
20 |
0.000 |
3 |
|
|
|
|
|
|
|
|
|
|
|
|
|
| glycolysis and gluconeogenesis |
FunCat |
20 |
0.000 |
3 |
|
|
|
|
|
|
|
|
|
|
|
|
|
| Glycolysis / Gluconeogenesis |
KEGG |
20 |
0.000 |
3 |
|
|
|
|
|
|
|
|
|
|
|
|
|
| chlorophyll and phytochromobilin metabolism |
LitPath |
20 |
0.000 |
2 |
|
|
|
|
|
|
|
|
|
|
|
|
|
| response to jasmonic acid stimulus |
TAIR-GO |
16 |
0.000 |
2 |
|
|
|
|
|
|
|
|
|
|
|
|
|
| lipoxygenase pathway |
AraCyc |
16 |
0.000 |
2 |
|
|
|
|
|
|
|
|
|
|
|
|
|
| Fructose and mannose metabolism |
KEGG |
16 |
0.000 |
2 |
|
|
|
|
|
|
|
|
|
|
|
|
|
| Pentose phosphate pathway |
KEGG |
16 |
0.000 |
2 |
|
|
|
|
|
|
|
|
|
|
|
|
|
| Starch and sucrose metabolism |
KEGG |
16 |
0.001 |
2 |
|
|
|
|
|
|
|
|
|
|
|
|
|
| alanine biosynthesis II |
AraCyc |
15 |
0.000 |
2 |
|
|
|
|
|
|
|
|
|
|
|
|
|
| Ion channels |
KEGG |
15 |
0.000 |
4 |
|
|
|
|
|
|
|
|
|
|
|
|
|
| Ligand-Receptor Interaction |
KEGG |
15 |
0.000 |
4 |
|
|
|
|
|
|
|
|
|
|
|
|
|
| nitrogen and sulfur utilization |
FunCat |
14 |
0.000 |
2 |
|
|
|
|
|
|
|
|
|
|
|
|
|
| photosynthesis |
FunCat |
14 |
0.000 |
2 |
|
|
|
|
|
|
|
|
|
|
|
|
|
| photorespiration |
TAIR-GO |
13 |
0.000 |
2 |
|
|
|
|
|
|
|
|
|
|
|
|
|
| colanic acid building blocks biosynthesis |
AraCyc |
13 |
0.023 |
3 |
|
|
|
|
|
|
|
|
|
|
|
|
|
| dTDP-rhamnose biosynthesis |
AraCyc |
13 |
0.002 |
3 |
|
|
|
|
|
|
|
|
|
|
|
|
|
| galactose degradation I |
AraCyc |
13 |
0.000 |
3 |
|
|
|
|
|
|
|
|
|
|
|
|
|
| glucose conversion |
AraCyc |
13 |
0.001 |
3 |
|
|
|
|
|
|
|
|
|
|
|
|
|
| lactose degradation IV |
AraCyc |
13 |
0.000 |
3 |
|
|
|
|
|
|
|
|
|
|
|
|
|
| UDP-glucose conversion |
AraCyc |
13 |
0.001 |
3 |
|
|
|
|
|
|
|
|
|
|
|
|
|
| Gluconeogenesis from lipids in seeds |
BioPath |
12 |
0.006 |
2 |
|
|
|
|
|
|
|
|
|
|
|
|
|
| cysteine biosynthesis I |
AraCyc |
12 |
0.007 |
5 |
|
|
|
|
|
|
|
|
|
|
|
|
|
| cysteine biosynthesis II |
AraCyc |
12 |
0.000 |
5 |
|
|
|
|
|
|
|
|
|
|
|
|
|
| phenylalanine degradation I |
AraCyc |
12 |
0.001 |
2 |
|
|
|
|
|
|
|
|
|
|
|
|
|
| serine biosynthesis |
AraCyc |
12 |
0.000 |
5 |
|
|
|
|
|
|
|
|
|
|
|
|
|
| starch degradation |
AraCyc |
12 |
0.000 |
2 |
|
|
|
|
|
|
|
|
|
|
|
|
|
| energy |
FunCat |
12 |
0.000 |
2 |
|
|
|
|
|
|
|
|
|
|
|
|
|
| metabolism of energy reserves (e.g. glycogen, trehalose) |
FunCat |
12 |
0.000 |
2 |
|
|
|
|
|
|
|
|
|
|
|
|
|
| calmodulin binding |
TAIR-GO |
11 |
0.000 |
2 |
|
|
|
|
|
|
|
|
|
|
|
|
|
| transport |
FunCat |
11 |
0.000 |
2 |
|
|
|
|
|
|
|
|
|
|
|
|
|
| Pathway for nuclear-encoded, thylakoid-localized proteins |
BioPath |
10 |
0.000 |
1 |
|
|
|
|
|
|
|
|
|
|
|
|
|
| SRP (signal recognition particle)-dependent pathway for integral membrane proteins |
BioPath |
10 |
0.000 |
1 |
|
|
|
|
|
|
|
|
|
|
|
|
|
| Transcriptional regulators (chloroplast) |
BioPath |
10 |
0.000 |
1 |
|
|
|
|
|
|
|
|
|
|
|
|
|
| chlorophyll catabolism |
TAIR-GO |
10 |
0.000 |
1 |
|
|
|
|
|
|
|
|
|
|
|
|
|
| positive regulation of transcription |
TAIR-GO |
10 |
0.000 |
1 |
|
|
|
|
|
|
|
|
|
|
|
|
|
|
|
|
|
|
|
|
|
|
|
|
|
|
|
|
|
|
|
|
|
|
|
|
|
|
|
|
|
|
|
|
|
|
|
|
|
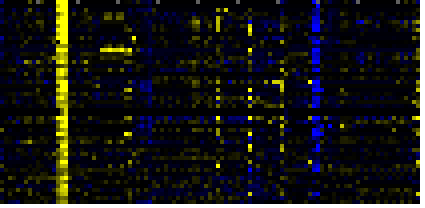
| Pathways co-expressed in the Hormone etc. data set (with more than 6 annotation points) |
|
CYP96A4 (At5g52320) |
|
|
|
|
|
|
|
|
|
| max. difference between log2-ratios: |
1.5 |
|
|
|
|
|
|
|
|
|
|
|
|
|
| max. difference between log2-ratios excluding lowest and highest 5%: |
7.0 |
|
|
|
|
|
|
|
|
|
|
|
|
|
| Pathway |
Source |
Scores of Genes |
p[Score] |
No. of Genes |
p[genes] |
Link to hormones etc. heatmap |
|
|
|
|
|
|
|
|
| Lipid signaling |
AcylLipid |
52 |
0.000 |
8 |
0.000 |
|
|
|
|
|
|
|
|
|
|
|
|
| response to wounding |
TAIR-GO |
40 |
0.000 |
5 |
0.000 |
|
|
|
|
|
|
|
| jasmonic acid biosynthesis |
AraCyc |
40 |
0.000 |
6 |
0.000 |
|
|
|
|
|
|
| lipoxygenase pathway |
AraCyc |
40 |
0.000 |
6 |
0.000 |
|
|
|
|
|
|
| Phenylpropanoid Metabolism |
BioPath |
38 |
0.000 |
7 |
0.004 |
|
|
|
|
|
|
| jasmonic acid biosynthesis |
TAIR-GO |
36 |
0.000 |
5 |
0.000 |
|
|
|
|
|
|
| Biosynthesis of Amino Acids and Derivatives |
BioPath |
30 |
0.001 |
5 |
0.040 |
|
|
|
|
|
|
| Isoprenoid Biosynthesis in the Cytosol and in Mitochondria |
BioPath |
30 |
0.000 |
3 |
0.015 |
|
|
|
|
|
|
| Glutathione metabolism |
BioPath |
22 |
0.000 |
3 |
0.021 |
|
|
|
|
|
|
| Aromatic amino acid (Phe, Tyr, Trp) metabolism |
BioPath |
20 |
0.000 |
2 |
0.052 |
|
|
|
|
|
|
| sulfate assimilation III |
AraCyc |
20 |
0.000 |
2 |
0.023 |
|
|
|
|
|
|
| Phenylalanine, tyrosine and tryptophan biosynthesis |
KEGG |
20 |
0.000 |
2 |
0.015 |
|
|
|
|
|
|
| Selenoamino acid metabolism |
KEGG |
20 |
0.000 |
2 |
0.005 |
|
|
|
|
|
|
| Sulfur metabolism |
KEGG |
20 |
0.000 |
2 |
0.002 |
|
|
|
|
|
|
| oxylipin pathway |
LitPath |
20 |
0.000 |
2 |
0.000 |
|
|
|
|
|
|
|
|
|
|
|
|
| Shikimate pathway |
LitPath |
20 |
0.002 |
2 |
0.162 |
|
|
|
|
|
|
|
|
|
|
|
|
| Tryptophan metabolism |
KEGG |
19 |
0.000 |
2 |
0.008 |
|
|
|
|
|
|
|
|
|
|
|
|
| defense response |
TAIR-GO |
17 |
0.000 |
3 |
0.001 |
|
|
|
|
|
|
|
|
|
|
|
|
| flavonoid biosynthesis |
AraCyc |
16 |
0.000 |
4 |
0.000 |
|
|
|
|
|
|
|
|
|
|
|
|
| lignin biosynthesis |
AraCyc |
16 |
0.000 |
4 |
0.001 |
|
|
|
|
|
|
|
|
|
|
|
|
| amino acid metabolism |
FunCat |
16 |
0.001 |
3 |
0.027 |
|
|
|
|
|
|
|
|
|
|
|
|
| glycolysis and gluconeogenesis |
FunCat |
14 |
0.002 |
2 |
0.142 |
|
|
|
|
|
|
|
|
|
|
|
|
| lipid, fatty acid and isoprenoid metabolism |
FunCat |
14 |
0.000 |
3 |
0.001 |
|
|
|
|
|
|
|
|
|
|
|
|
| transport |
FunCat |
13 |
0.000 |
3 |
0.000 |
|
|
|
|
|
|
|
|
|
|
|
|
| transport facilitation |
FunCat |
13 |
0.000 |
3 |
0.000 |
|
|
|
|
|
|
|
|
|
|
|
|
| Alkaloid biosynthesis I |
KEGG |
13 |
0.000 |
2 |
0.002 |
|
|
|
|
|
|
|
|
|
|
|
|
| Glutathione metabolism |
KEGG |
13 |
0.000 |
3 |
0.001 |
|
|
|
|
|
|
|
|
|
|
|
|
| Tyrosine metabolism |
KEGG |
13 |
0.000 |
2 |
0.012 |
|
|
|
|
|
|
|
|
|
|
|
|
| core phenylpropanoid metabolism |
BioPath |
12 |
0.001 |
2 |
0.031 |
|
|
|
|
|
|
|
|
|
|
|
|
| Purine metabolism |
KEGG |
12 |
0.001 |
2 |
0.035 |
|
|
|
|
|
|
|
|
|
|
|
|
| transport ATPases |
FunCat |
11 |
0.000 |
2 |
0.005 |
|
|
|
|
|
|
|
|
|
|
|
|
| Arginine and proline metabolism |
KEGG |
11 |
0.000 |
2 |
0.014 |
|
|
|
|
|
|
|
|
|
|
|
|
| Biosynthesis of prenyl diphosphates |
BioPath |
10 |
0.022 |
1 |
0.147 |
|
|
|
|
|
|
|
|
|
|
|
|
| brassinosteroid biosynthesis |
BioPath |
10 |
0.000 |
1 |
0.001 |
|
|
|
|
|
|
|
|
|
|
|
|
| Chlorophyll biosynthesis and breakdown |
BioPath |
10 |
0.007 |
1 |
0.091 |
|
|
|
|
|
|
|
|
|
|
|
|
| sterol biosynthesis |
BioPath |
10 |
0.001 |
1 |
0.060 |
|
|
|
|
|
|
|
|
|
|
|
|
| sucrose metabolism |
BioPath |
10 |
0.000 |
1 |
0.034 |
|
|
|
|
|
|
|
|
|
|
|
|
| anthranilate synthase complex |
TAIR-GO |
10 |
0.000 |
1 |
0.000 |
|
|
|
|
|
|
|
|
|
|
|
|
| aromatic amino acid family biosynthesis |
TAIR-GO |
10 |
0.000 |
1 |
0.036 |
|
|
|
|
|
|
|
|
|
|
|
|
| aromatic amino acid family biosynthesis, anthranilate pathway |
TAIR-GO |
10 |
0.000 |
1 |
0.000 |
|
|
|
|
|
|
|
|
|
|
|
|
| aromatic amino acid family biosynthesis, shikimate pathway |
TAIR-GO |
10 |
0.000 |
1 |
0.027 |
|
|
|
|
|
|
|
|
|
|
|
|
| brassinosteroid biosynthesis |
TAIR-GO |
10 |
0.000 |
1 |
0.027 |
|
|
|
|
|
|
|
|
|
|
|
|
| chlorophyll catabolism |
TAIR-GO |
10 |
0.000 |
1 |
0.001 |
|
|
|
|
|
|
|
|
|
|
|
|
| cysteine biosynthesis |
TAIR-GO |
10 |
0.000 |
1 |
0.001 |
|
|
|
|
|
|
|
|
|
|
|
|
| growth |
TAIR-GO |
10 |
0.003 |
2 |
0.014 |
|
|
|
|
|
|
|
|
|
|
|
|
| response to biotic stimulus |
TAIR-GO |
10 |
0.000 |
1 |
0.000 |
|
|
|
|
|
|
|
|
|
|
|
|
| response to jasmonic acid stimulus |
TAIR-GO |
10 |
0.000 |
1 |
0.009 |
|
|
|
|
|
|
|
|
|
|
|
|
| response to light |
TAIR-GO |
10 |
0.004 |
1 |
0.193 |
|
|
|
|
|
|
|
|
|
|
|
|
| response to pathogenic bacteria |
TAIR-GO |
10 |
0.000 |
1 |
0.004 |
|
|
|
|
|
|
|
|
|
|
|
|
| response to stress |
TAIR-GO |
10 |
0.000 |
1 |
0.003 |
|
|
|
|
|
|
|
|
|
|
|
|
| steroid biosynthesis |
TAIR-GO |
10 |
0 |
1 |
0.03 |
|
|
|
|
|
|
|
|
|
|
|
|
|
|
|
|
|
|
|
|
|
|
|
|
|
|
|
|
|
|
|
|
|
|
|
|
|
|
|
|
|
|
|
|
|
|
|
|
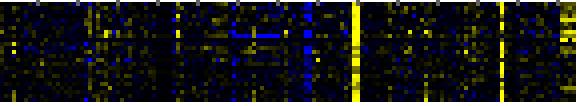
| Pathways co-expressed in the Mutant data set (with more than 10 annotation points) |
|
CYP96A4 (At5g52320) |
|
|
|
|
|
|
|
|
|
| max. difference between log2-ratios: |
2.0 |
|
|
|
|
|
|
|
|
|
|
|
|
|
| max. difference between log2-ratios excluding lowest and highest 5%: |
5.7 |
|
|
|
|
|
|
|
|
|
|
|
|
|
| Pathway |
Source |
Scores of Genes |
p[Score] |
No. of Genes |
p[genes] |
Link to mutants heatmap |
|
|
|
|
|
|
|
|
| jasmonic acid biosynthesis |
TAIR-GO |
26 |
0.000 |
3 |
0.000 |
|
|
|
|
|
|
|
|
|
|
|
|
| response to wounding |
TAIR-GO |
26 |
0.000 |
3 |
0.000 |
|
|
|
|
|
| jasmonic acid biosynthesis |
AraCyc |
26 |
0.000 |
3 |
0.000 |
|
|
|
|
| Lipid signaling |
AcylLipid |
26 |
0.000 |
3 |
0.015 |
|
|
|
|
| Cell Wall Carbohydrate Metabolism |
BioPath |
16 |
0.001 |
3 |
0.070 |
|
|
|
|
| lipoxygenase pathway |
AraCyc |
16 |
0.000 |
2 |
0.000 |
|
|
|
|
| secondary metabolism |
FunCat |
14 |
0.000 |
2 |
0.006 |
|
|
|
|
| Aromatic amino acid (Phe, Tyr, Trp) metabolism |
BioPath |
10 |
0.000 |
2 |
0.002 |
|
|
|
|
| Chlorophyll biosynthesis and breakdown |
BioPath |
10 |
0.000 |
1 |
0.011 |
|
|
|
|
|
|
|
|
|
|
|
|
| Phenylpropanoid Metabolism |
BioPath |
10 |
0.011 |
2 |
0.047 |
|
|
|
|
|
|
|
|
|
|
|
|
| Plastidial Isoprenoids (Chlorophylls, Carotenoids, Tocopherols, Plastoquinone, Phylloquinone) |
BioPath |
10 |
0.000 |
1 |
0.060 |
|
|
|
|
|
|
|
|
|
|
|
|
| response to jasmonic acid stimulus |
TAIR-GO |
10 |
0.000 |
1 |
0.001 |
|
|
|
|
|
|
|
|
|
|
|
|
| biosynthesis of proto- and siroheme |
AraCyc |
10 |
0.000 |
1 |
0.014 |
|
|
|
|
|
|
|
|
|
|
|
|
| aerobic respiration |
FunCat |
10 |
0.000 |
1 |
0.004 |
|
|
|
|
|
|
|
|
|
|
|
|
| biogenesis of chloroplast |
FunCat |
10 |
0.000 |
1 |
0.057 |
|
|
|
|
|
|
|
|
|
|
|
|
| respiration |
FunCat |
10 |
0.000 |
1 |
0.004 |
|
|
|
|
|
|
|
|
|
|
|
|
| Porphyrin and chlorophyll metabolism |
KEGG |
10 |
0.000 |
1 |
0.002 |
|
|
|
|
|
|
|
|
|
|
|
|
| chlorophyll and phytochromobilin metabolism |
LitPath |
10 |
0.000 |
1 |
0.041 |
|
|
|
|
|
|
|
|
|
|
|
|
| oxylipin pathway |
LitPath |
10 |
0.000 |
1 |
0.000 |
|
|
|
|
|
|
|
|
|
|
|
|
| phytochromobilin biosynthesis |
LitPath |
10 |
0.000 |
1 |
0.002 |
|
|
|
|
|
|
|
|
|
|
|
|
| cellulose biosynthesis |
BioPath |
8 |
0.000 |
1 |
0.020 |
|
|
|
|
|
|
|
|
|
|
|
|
| hemicellulose biosynthesis |
BioPath |
8 |
0.000 |
1 |
0.003 |
|
|
|
|
|
|
|
|
|
|
|
|
| biogenesis of cell wall |
FunCat |
8 |
0.000 |
1 |
0.062 |
|
|
|
|
|
|
|
|
|
|
|
|
| C-compound and carbohydrate utilization |
FunCat |
8 |
0.000 |
2 |
0.000 |
|
|
|
|
|
|
|
|
|
|
|
|
| Starch and sucrose metabolism |
KEGG |
8 |
0.000 |
2 |
0.001 |
|
|
|
|
|
|
|
|
|
|
|
|
|
|
|
|
|
|
|
|
|
|
|
|
|
|
|
|
|
|