|
|
|
|
|
|
|
|
|
|
|
|
|
|
| Pathways co-expressed in two data set with differential expression |
(more than 6 points in each set) |
|
|
|
|
|
|
|
|
|
|
|
|
| Pathway |
Source |
Sum of scores |
Sum of genes |
|
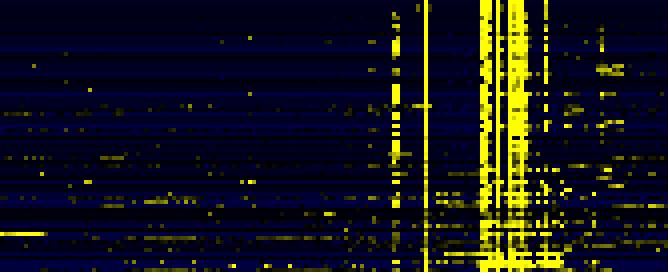
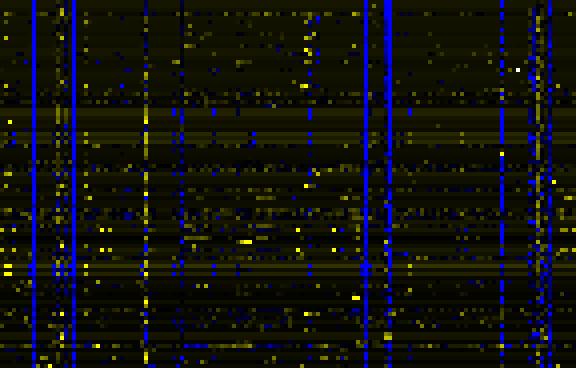
Find below a list of pathways that are co-expressed with the bait. First a list of pathways is given that are co-expressed in all four data sets. Lists for each individual dataset are shown underneath. To the right of each table a thumbnail of the actual co-expression heatmap is given. Klick on the link to see the heatmap containing all co-expressed genes. |
|
|
|
|
|
|
| Cell Wall Carbohydrate Metabolism |
BioPath |
245 |
70 |
|
|
|
|
|
|
|
| pectin metabolism |
BioPath |
159 |
53 |
|
|
|
|
|
|
|
| Miscellaneous acyl lipid metabolism |
AcylLipid |
118 |
45 |
|
|
|
|
|
|
|
| Fatty acid elongation and wax and cutin metabolism |
AcylLipid |
83 |
24 |
|
|
|
|
|
|
|
| cellulose biosynthesis |
BioPath |
70 |
12 |
|
For more information on how these pathway maps were generated please read the methods page |
|
|
|
|
|
|
| fatty acid metabolism |
TAIR-GO |
68 |
13 |
|
|
|
|
|
|
|
| Glycan Biosynthesis and Metabolism |
KEGG |
50 |
7 |
|

|
|
|
|
|
|
|
|
| Fructose and mannose metabolism |
KEGG |
48 |
8 |
|
|
|
|
|
|
|
|
| Glycerolipid metabolism |
KEGG |
38 |
5 |
|
|
|
|
|
|
|
|
| triacylglycerol degradation |
AraCyc |
36 |
15 |
|
|
|
|
|
|
|
|
| long-chain fatty acid metabolism |
TAIR-GO |
36 |
8 |
|
|
|
|
|
|
|
|
|
| hemicellulose biosynthesis |
BioPath |
32 |
4 |
|
|
|
|
|
|
|
|
|
|
| Diterpenoid biosynthesis |
KEGG |
30 |
3 |
|
|
|
|
|
|
|
|
|
|
| Gibberellin metabolism |
LitPath |
30 |
3 |
|
|
|
|
|
|
|
|
|
|
| gibberellic acid catabolism |
TAIR-GO |
29 |
3 |
|
|
|
|
|
|
|
|
|
|
| ubiquinone biosynthesis |
BioPath |
24 |
3 |
|
|
|
|
|
|
|
|
|
|
| cell wall organization and biogenesis (sensu Magnoliophyta) |
TAIR-GO |
24 |
3 |
|
|
|
|
|
|
|
|
|
|
| biosynthesis of proto- and siroheme |
AraCyc |
24 |
4 |
|
|
|
|
|
|
|
|
|
|
| ubiquinone biosynthesis |
LitPath |
24 |
3 |
|
|
|
|
|
|
|
|
|
|
|
|
|
|
|
|
|
|
|
|
|
|
|
|
|
|
|
|
|
|
|
|
|
|
|
|
|
|
| Pathways co-expressed in the Organ and Tissue data set |
|
CYP98A8 (At1g74540) |
|
|
|
|
|
|
|
|
| max. difference between log2-ratios: |
8.29 |
|
|
|
|
|
|
|
|
|
|
|
|
| max. difference between log2-ratios excluding lowest and highest 5%: |
3.94 |
|
|
|
|
|
|
|
|
|
|
|
|
| Pathway |
Source |
Scores of Genes |
p[Score] |
No. of Genes |
p[genes] |
Link to organ heatmap |
|
|
|
|
| Miscellaneous acyl lipid metabolism |
AcylLipid |
42 |
0.000 |
15 |
0.001 |
|
| Fatty acid elongation and wax and cutin metabolism |
AcylLipid |
34 |
0.000 |
8 |
0.002 |
| fatty acid metabolism |
TAIR-GO |
26 |
0.000 |
4 |
0.000 |
| Isoprenoid Biosynthesis in the Cytosol and in Mitochondria |
BioPath |
22 |
0.000 |
4 |
0.001 |
| Cell Wall Carbohydrate Metabolism |
BioPath |
20 |
0.002 |
5 |
0.187 |
| sexual reproduction |
TAIR-GO |
20 |
0.000 |
5 |
0.000 |
| Biosynthesis of prenyl diphosphates |
BioPath |
14 |
0.000 |
3 |
0.001 |
| triacylglycerol degradation |
AraCyc |
14 |
0.000 |
6 |
0.000 |
| polyisoprenoid biosynthesis |
AraCyc |
12 |
0.000 |
3 |
0.000 |
| Phenylpropanoid pathway |
LitPath |
11 |
0.002 |
5 |
0.001 |
|
|
|
|
|
|
|
|
|
|
|
|
|
|
|
|
|
|
|
|
|
|
|
|
|
|
|
|
|
|
|
|
|
|
|
|
|
|
|
|
|
|
|
|
|
|
|
|
|
|
|
|
| Pathways co-expressed in the Mutant data set |
|
CYP98A8 (At1g74540) |
|
|
|
|
|
|
|
|
| max. difference between log2-ratios: |
8.09 |
|
|
|
|
|
|
|
|
|
|
|
|
| max. difference between log2-ratios excluding lowest and highest 5%: |
1.00 |
|
|
|
|
|
|
|
|
|
|
|
|
| Pathway |
Source |
Scores of Genes |
p[Score] |
No. of Genes |
p[genes] |
|
|
|
|
|
|
|
|
| Cell Wall Carbohydrate Metabolism |
BioPath |
93 |
0.000 |
24 |
0.000 |
Link to mutants heatmap |
|
|
|
|
| pectin metabolism |
BioPath |
77 |
0.000 |
21 |
0.000 |
|
|
| Miscellaneous acyl lipid metabolism |
AcylLipid |
54 |
0.000 |
21 |
0.000 |
|
| C-compound and carbohydrate metabolism |
FunCat |
46 |
0.000 |
13 |
0.009 |
|
| Starch and sucrose metabolism |
KEGG |
33 |
0.000 |
6 |
0.000 |
|
| Phenylpropanoid pathway |
LitPath |
31 |
0.000 |
7 |
0.000 |
|
| biogenesis of cell wall |
FunCat |
26 |
0.000 |
9 |
0.000 |
|
| Glycan Biosynthesis and Metabolism |
KEGG |
26 |
0.000 |
4 |
0.002 |
|
| core phenylpropanoid metabolism |
BioPath |
24 |
0.000 |
4 |
0.009 |
|
| Fatty acid elongation and wax and cutin metabolism |
AcylLipid |
22 |
0.001 |
7 |
0.066 |
|
| Isoprenoid Biosynthesis in the Cytosol and in Mitochondria |
BioPath |
20 |
0.001 |
3 |
0.108 |
|
| sexual reproduction |
TAIR-GO |
20 |
0.000 |
5 |
0.000 |
|
| Glutamate/glutamine from nitrogen fixation |
BioPath |
14 |
0.000 |
2 |
0.005 |
|
| fatty acid metabolism |
TAIR-GO |
14 |
0.000 |
3 |
0.000 |
|
| long-chain fatty acid metabolism |
TAIR-GO |
14 |
0.000 |
3 |
0.000 |
|
| very-long-chain fatty acid metabolism |
TAIR-GO |
14 |
0.000 |
3 |
0.000 |
|
| lactose degradation IV |
AraCyc |
14 |
0.000 |
4 |
0.000 |
|
| triacylglycerol degradation |
AraCyc |
14 |
0.000 |
6 |
0.000 |
|
| assimilation of ammonia, metabolism of the glutamate group |
FunCat |
14 |
0.000 |
2 |
0.018 |
|
| nitrogen and sulfur metabolism |
FunCat |
14 |
0.000 |
2 |
0.015 |
|
| Glutamate metabolism |
KEGG |
14 |
0.000 |
2 |
0.023 |
|
|
|
|
|
|
|
|
| Glycerolipid metabolism |
KEGG |
14 |
0.000 |
2 |
0.011 |
|
|
|
|
|
|
|
|
| Nitrogen metabolism |
KEGG |
14 |
0.000 |
2 |
0.010 |
|
|
|
|
|
|
|
|
| Oxidative phosphorylation |
KEGG |
14 |
0.000 |
3 |
0.020 |
|
|
|
|
|
|
|
|
| Biosynthesis of prenyl diphosphates |
BioPath |
12 |
0.023 |
2 |
0.134 |
|
|
|
|
|
|
|
|
| Galactose metabolism |
KEGG |
12 |
0.000 |
2 |
0.010 |
|
|
|
|
|
|
|
|
| lignin biosynthesis |
AraCyc |
11 |
0.001 |
5 |
0.000 |
|
|
|
|
|
|
|
|
| isoprenoid biosynthesis |
FunCat |
11 |
0.042 |
3 |
0.080 |
|
|
|
|
|
|
|
|
| lipid, fatty acid and isoprenoid biosynthesis |
FunCat |
11 |
0.017 |
3 |
0.053 |
|
|
|
|
|
|
|
|
|
|
|
|
|
|
|
|
|
|
|
|
|
|