|
|
|
|
|
|
|
|
|
|
|
|
|
|
|
|
|
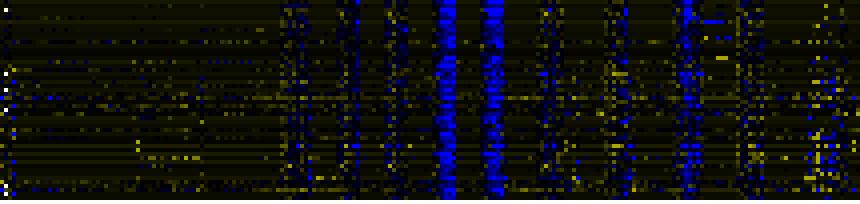
| Pathways co-expressed in the Stress data set ( with more than 10 annotation points) |
|
CYP702A2 (At4g15300) |
|
|
|
|
|
|
|
|
| max. difference between log2-ratios: |
4.7 |
|
|
|
|
|
|
|
|
|
|
|
|
| max. difference between log2-ratios excluding lowest and highest 5%: |
1.6 |
|
|
|
|
|
|
|
|
|
|
|
|
| Pathway |
Source |
Scores of Genes |
p[Score] |
No. of Genes |
p[genes] |
Link to stress heatmap |
|
|
|
|
|
|
|
| Cell Wall Carbohydrate Metabolism |
BioPath |
44.5 |
0.000 |
10 |
0.077 |
|
| Fructose and mannose metabolism |
KEGG |
32 |
0.000 |
5 |
0.000 |
| Glucosinolate Metabolism |
LitPath |
30 |
0.000 |
3 |
0.001 |
| Biosynthesis of Amino Acids and Derivatives |
BioPath |
28 |
0.009 |
5 |
0.126 |
| Stilbene, coumarine and lignin biosynthesis |
KEGG |
28 |
0.000 |
10 |
0.000 |
| Branched-chain amino acids from aspartate |
BioPath |
24 |
0.000 |
3 |
0.002 |
| leucine biosynthesis |
AraCyc |
24 |
0.000 |
3 |
0.000 |
| Pyruvate metabolism |
KEGG |
24 |
0.000 |
3 |
0.069 |
| Isoprenoid Biosynthesis in the Cytosol and in Mitochondria |
BioPath |
22 |
0.000 |
3 |
0.040 |
| Valine, leucine and isoleucine biosynthesis |
KEGG |
22 |
0.000 |
3 |
0.004 |
| triterpene, sterol, and brassinosteroid metabolism |
LitPath |
21 |
0.000 |
4 |
0.025 |
| glucosinolate biosynthesis |
TAIR-GO |
20 |
0.000 |
2 |
0.000 |
| Benzoate degradation via CoA ligation |
KEGG |
18 |
0.000 |
2 |
0.301 |
|
|
|
|
|
|
|
|
|
|
|
| Inositol phosphate metabolism |
KEGG |
18 |
0.000 |
2 |
0.349 |
|
|
|
|
|
|
|
|
|
|
|
| Methane metabolism |
KEGG |
18 |
0.000 |
9 |
0.000 |
|
|
|
|
|
|
|
|
|
|
|
| Nicotinate and nicotinamide metabolism |
KEGG |
18 |
0.000 |
2 |
0.260 |
|
|
|
|
|
|
|
|
|
|
|
| Phenylalanine metabolism |
KEGG |
18 |
0.000 |
9 |
0.000 |
|
|
|
|
|
|
|
|
|
|
|
| Prostaglandin and leukotriene metabolism |
KEGG |
18 |
0.000 |
9 |
0.000 |
|
|
|
|
|
|
|
|
|
|
|
| cellulose biosynthesis |
BioPath |
16 |
0.000 |
2 |
0.065 |
|
|
|
|
|
|
|
|
|
|
|
| hemicellulose biosynthesis |
BioPath |
16 |
0.000 |
2 |
0.004 |
|
|
|
|
|
|
|
|
|
|
|
| Glycan Biosynthesis and Metabolism |
KEGG |
16 |
0.000 |
2 |
0.154 |
|
|
|
|
|
|
|
|
|
|
|
| Glycerolipid metabolism |
KEGG |
16 |
0.000 |
2 |
0.033 |
|
|
|
|
|
|
|
|
|
|
|
| transport |
FunCat |
14 |
0.000 |
3 |
0.000 |
|
|
|
|
|
|
|
|
|
|
|
| transport facilitation |
FunCat |
14 |
0.000 |
3 |
0.000 |
|
|
|
|
|
|
|
|
|
|
|
| Biosynthesis of prenyl diphosphates |
BioPath |
12 |
0.005 |
2 |
0.061 |
|
|
|
|
|
|
|
|
|
|
|
| GDP-carbohydrate biosynthesis |
BioPath |
12 |
0.000 |
2 |
0.001 |
|
|
|
|
|
|
|
|
|
|
|
| colanic acid building blocks biosynthesis |
AraCyc |
12 |
0.000 |
2 |
0.011 |
|
|
|
|
|
|
|
|
|
|
|
| polyprenyl diphosphate biosynthesis |
LitPath |
12 |
0.000 |
2 |
0.001 |
|
|
|
|
|
|
|
|
|
|
|
| secondary metabolism |
FunCat |
11 |
0.001 |
3 |
0.016 |
|
|
|
|
|
|
|
|
|
|
|
|
|
|
|
|
|
|
|
|
|
|
|
|
|
|
|
|
|
|
|
|
|
|
|
|
|
|
|
|
|
|
|
|
|
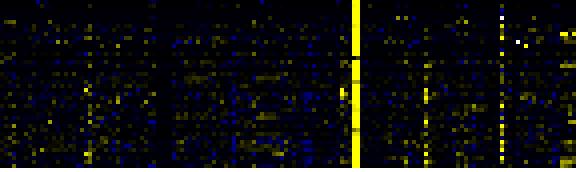
| Pathways co-expressed in the Hormone etc. data set (with more than 10 annotation points) |
|
CYP702A2 (At4g15300) |
|
|
|
|
|
|
|
|
| max. difference between log2-ratios: |
4.8 |
|
|
|
|
|
|
|
|
|
|
|
|
| max. difference between log2-ratios excluding lowest and highest 5%: |
0.0 |
|
|
|
|
|
|
|
|
|
|
|
|
| Pathway |
Source |
Scores of Genes |
p[Score] |
No. of Genes |
p[genes] |
Link to hormones etc. heatmap |
|
|
|
|
|
|
|
| Cell Wall Carbohydrate Metabolism |
BioPath |
14.5 |
0.003 |
3 |
0.070 |

|
|
|
|
|
|
| core phenylpropanoid metabolism |
BioPath |
12 |
0.000 |
2 |
0.001 |
|
|
|
|
|
| Phenylpropanoid Metabolism |
BioPath |
12 |
0.000 |
2 |
0.047 |
|
|
|
|
|
| Lipid signaling |
AcylLipid |
11 |
0.000 |
2 |
0.015 |
|
|
|
|
|
| cellulose biosynthesis |
BioPath |
10 |
0.000 |
1 |
0.020 |
|
|
|
|
|
| hemicellulose biosynthesis |
BioPath |
10 |
0.000 |
1 |
0.003 |
|
|
|
|
|
|
|
|
|
|
|
| Fructose and mannose metabolism |
KEGG |
10 |
0.000 |
1 |
0.001 |
|
|
|
|
|
|
|
|
|
|
|
| Glycan Biosynthesis and Metabolism |
KEGG |
10 |
0.000 |
1 |
0.002 |
|
|
|
|
|
|
|
|
|
|
|
| Glycerolipid metabolism |
KEGG |
10 |
0.000 |
1 |
0.001 |
|
|
|
|
|
|
|
|
|
|
|
| lipases pathway |
AraCyc |
9 |
0.000 |
1 |
0.000 |
|
|
|
|
|
|
|
|
|
|
|
| degradation |
FunCat |
9 |
0.000 |
1 |
0.001 |
|
|
|
|
|
|
|
|
|
|
|
| intracellular signalling |
FunCat |
9 |
0.000 |
1 |
0.003 |
|
|
|
|
|
|
|
|
|
|
|
| lipid, fatty acid and isoprenoid degradation |
FunCat |
9 |
0.000 |
1 |
0.001 |
|
|
|
|
|
|
|
|
|
|
|
| second messenger mediated signal transduction |
FunCat |
9 |
0.000 |
1 |
0.000 |
|
|
|
|
|
|
|
|
|
|
|
| mono-/sesqui-/di-terpene biosynthesis |
LitPath |
8 |
0.000 |
2 |
0.003 |
|
|
|
|
|
|
|
|
|
|
|
| terpenoid metabolism |
LitPath |
8 |
0.000 |
2 |
0.003 |
|
|
|
|
|
|
|
|
|
|
|
|
|
|
|
|
|
|
|
|
|
|
|
|
|
|
|
|
|
|
|
|
|
|
|
|
|
|
|
|
|
|
|
|
|
|
|
|
|
|
|
|
|
|
|
|
|
|
|
|
|
|
| Pathways co-expressed in the Mutant data set (with more than 10 annotation points) |
|
CYP702A2 (At4g15300) |
|
|
|
|
|
|
|
|
| max. difference between log2-ratios: |
1.7 |
|
|
|
|
|
|
|
|
|
|
|
|
| max. difference between log2-ratios excluding lowest and highest 5%: |
0.0 |
|
|
|
|
|
|
|
|
|
|
|
|
| Pathway |
Source |
Scores of Genes |
p[Score] |
No. of Genes |
p[genes] |
Link to mutants heatmap |
|
|
|
|
|
|
|
| Phenylpropanoid pathway |
LitPath |
32 |
0.000 |
6 |
0.000 |
|
|
|
|
| Phenylpropanoid Metabolism |
BioPath |
22 |
0.000 |
4 |
0.009 |
|
|
|
| lignin biosynthesis |
AraCyc |
20 |
0.000 |
4 |
0.000 |
|
|
|
| Nucleotide sugars metabolism |
KEGG |
16 |
0.000 |
3 |
0.000 |
|
|
|
| biogenesis of chloroplast |
FunCat |
14 |
0.000 |
2 |
0.013 |
|
|
|
| core phenylpropanoid metabolism |
BioPath |
12 |
0.000 |
2 |
0.005 |
|
|
|
| Aromatic amino acid (Phe, Tyr, Trp) metabolism |
BioPath |
10 |
0.000 |
2 |
0.009 |
|
|
|
| Chlorophyll biosynthesis and breakdown |
BioPath |
10 |
0.000 |
1 |
0.027 |
|
|
|
| Methionin/SAM/ethylene metabolism from cysteine and aspartate |
BioPath |
10 |
0.000 |
1 |
0.023 |
|
|
|
| Plastidial Isoprenoids (Chlorophylls, Carotenoids, Tocopherols, Plastoquinone, Phylloquinone) |
BioPath |
10 |
0.012 |
1 |
0.139 |
|
|
|
| ethylene biosynthesis |
TAIR-GO |
10 |
0.000 |
1 |
0.001 |
|
|
|
| gibberellic acid catabolism |
TAIR-GO |
10 |
0.000 |
1 |
0.000 |
|
|
|
|
|
|
|
|
|
|
|
| lignin biosynthesis |
TAIR-GO |
10 |
0.000 |
1 |
0.001 |
|
|
|
|
|
|
|
|
|
|
|
| phenylpropanoid metabolism |
TAIR-GO |
10 |
0.000 |
1 |
0.000 |
|
|
|
|
|
|
|
|
|
|
|
| biosynthesis of proto- and siroheme |
AraCyc |
10 |
0.000 |
1 |
0.019 |
|
|
|
|
|
|
|
|
|
|
|
| aerobic respiration |
FunCat |
10 |
0.000 |
1 |
0.007 |
|
|
|
|
|
|
|
|
|
|
|
| respiration |
FunCat |
10 |
0.000 |
1 |
0.007 |
|
|
|
|
|
|
|
|
|
|
|
| secondary metabolism |
FunCat |
10 |
0.000 |
1 |
0.088 |
|
|
|
|
|
|
|
|
|
|
|
| Diterpenoid biosynthesis |
KEGG |
10 |
0.000 |
1 |
0.002 |
|
|
|
|
|
|
|
|
|
|
|
| Porphyrin and chlorophyll metabolism |
KEGG |
10 |
0.000 |
1 |
0.008 |
|
|
|
|
|
|
|
|
|
|
|
| Propanoate metabolism |
KEGG |
10 |
0.000 |
1 |
0.010 |
|
|
|
|
|
|
|
|
|
|
|
| chlorophyll and phytochromobilin metabolism |
LitPath |
10 |
0.008 |
1 |
0.112 |
|
|
|
|
|
|
|
|
|
|
|
| Gibberellin metabolism |
LitPath |
10 |
0.000 |
1 |
0.034 |
|
|
|
|
|
|
|
|
|
|
|
| giberelin catabolism |
LitPath |
10 |
0.000 |
1 |
0.000 |
|
|
|
|
|
|
|
|
|
|
|
| phytochromobilin biosynthesis |
LitPath |
10 |
0.000 |
1 |
0.006 |
|
|
|
|
|
|
|
|
|
|
|
| arabinose biosynthesis |
TAIR-GO |
9 |
0.000 |
1 |
0.000 |
|
|
|
|
|
|
|
|
|
|
|
| cell wall biosynthesis (sensu Magnoliophyta) |
TAIR-GO |
9 |
0.000 |
1 |
0.003 |
|
|
|
|
|
|
|
|
|
|
|
| IAA conjugate biosynthesis II |
AraCyc |
9 |
0.000 |
1 |
0.000 |
|
|
|
|
|
|
|
|
|
|
|
| Galactose metabolism |
KEGG |
9 |
0.000 |
1 |
0.011 |
|
|
|
|
|
|
|
|
|
|
|
| Translation factors |
KEGG |
8 |
0.000 |
3 |
0.001 |
|
|
|
|
|
|
|
|
|
|
|
| response to auxin stimulus |
TAIR-GO |
7 |
0.000 |
1 |
0.001 |
|
|
|
|
|
|
|
|
|
|
|
|
|
|
|
|
|
|
|
|
|
|
|
|
|
|
|
|