Co-Expression Analysis of:
CYPedia Home
Institut de Biologie Moléculaire des Plantes (Home)
CYP703A2 (At1g01280)
save all data as tab delimited file
Find below a list of pathways that are co-expressed with the bait. First a list of pathways is given that are co-expressed in all four data sets. Lists for each individual dataset are shown underneath. To the right of each table a thumbnail of the actual co-expression heatmap is given. Klick on the link to see the heatmap containing all co-expressed genes.
Pathways co-expressed in the 3 data sets that apply (with more than 6 annotation points each)
Pathway
Source
Sum of scores
Sum of genes
cellulose biosynthesis
BioPath
66
10
fatty acid metabolism
TAIR-GO
41
9
For more information on how these pathway maps were generated please read the methods page
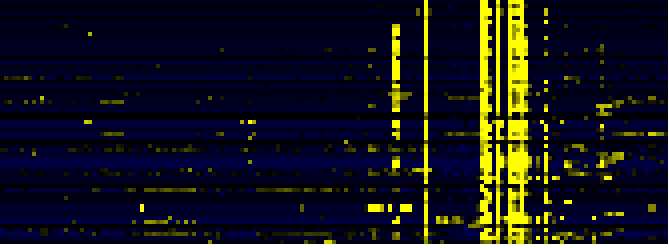
Pathways co-expressed in the Organ and Tissue data set (with more than 10 annotation points)
CYP703A2 (At1g01280)
max. difference between log2-ratios:
8.71
max. difference between log2-ratios excluding lowest and highest 5%:
0.00
Pathway
Source
Scores of Genes
p[Score]
No. of Genes
p[genes]
Link to organ heatmap
Miscellaneous acyl lipid metabolism
AcylLipid
42
0.000
15
0.000
Cell Wall Carbohydrate Metabolism
BioPath
26
0.000
6
0.074
Fatty acid elongation and wax and cutin metabolism
AcylLipid
25
0.000
7
0.004
sexual reproduction
TAIR-GO
20
0.000
5
0.000
pectin metabolism
BioPath
18
0.000
5
0.005
fatty acid metabolism
TAIR-GO
17
0.000
3
0.000
Biosynthesis of prenyl diphosphates
BioPath
14
0.000
3
0.001
Isoprenoid Biosynthesis in the Cytosol and in Mitochondria
BioPath
14
0.000
3
0.005
Phenylpropanoid pathway
LitPath
11
0.001
5
0.001
gibberellic acid catabolism
TAIR-GO
10
0.000
1
0.001
Diterpenoid biosynthesis
KEGG
10
0.000
1
0.001
Gibberellin metabolism
LitPath
10
0.000
1
0.034
giberelin catabolism
LitPath
10
0.000
1
0.000
prenyl diphosphate (GPP,FPP, GGPP) biosynthesis
LitPath
10
0.000
1
0.026
Pathways co-expressed in the Stress data set (with more than 6 annotation points)
CYP703A2 (At1g01280)
max. difference between log2-ratios:
3.58
max. difference between log2-ratios excluding lowest and highest 5%:
0.00
Pathway
Source
Scores of Genes
p[Score]
No. of Genes
p[genes]
cytokinin biosynthesis
TAIR-GO
7
0.000
1
0.000
Link to stress heatmap
trans-zeatin biosynthesis
AraCyc
7
0.000
1
0.000
![]()
RNA modification
FunCat
7
0.000
1
0.000
RNA synthesis
FunCat
7
0.000
1
0.002
transcription
FunCat
7
0.000
1
0.001
tRNA modification
FunCat
7
0.000
1
0.000
tRNA synthesis
FunCat
7
0.000
1
0.000
Pathways co-expressed in the Hormone etc. data set
CYP703A2 (At1g01280)
max. difference between log2-ratios:
0.41
max. difference between log2-ratios excluding lowest and highest 5%:
0.00
Bait is not differentially expressed in this data set (except in sample IAA, 1uM, 3h, seedling (144); value -0.41).
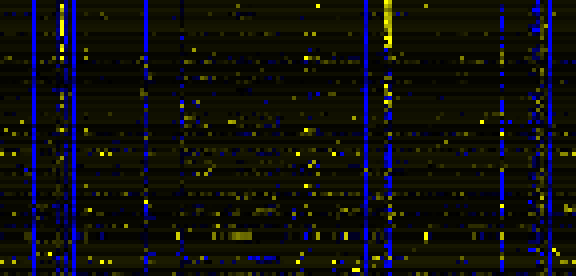
Pathways co-expressed in the Mutant data set (with more than 10 annotation points)
CYP703A2 (At1g01280)
max. difference between log2-ratios:
10.51
max. difference between log2-ratios excluding lowest and highest 5%:
0.66
Pathway
Source
Scores of Genes
p[Score]
No. of Genes
p[genes]
Phenylpropanoid Metabolism
BioPath
43
0.000
10
0.000
Link to mutants heatmap
Cell Wall Carbohydrate Metabolism
BioPath
34
0.000
8
0.064
Phenylpropanoid pathway
LitPath
31
0.000
7
0.000
Miscellaneous acyl lipid metabolism
AcylLipid
30
0.000
14
0.000
core phenylpropanoid metabolism
BioPath
26
0.000
5
0.000
Ribosome
KEGG
24
0.000
4
0.032
C-compound and carbohydrate metabolism
FunCat
22
0.000
6
0.028
pectin metabolism
BioPath
20
0.000
6
0.007
Fatty acid elongation and wax and cutin metabolism
AcylLipid
17
0.000
7
0.002
protein synthesis
FunCat
12
0.001
2
0.174
ribosome biogenesis
FunCat
12
0.021
2
0.297