|
|
|
|
|
|
|
|
|
|
|
|
|
|
|
|
|
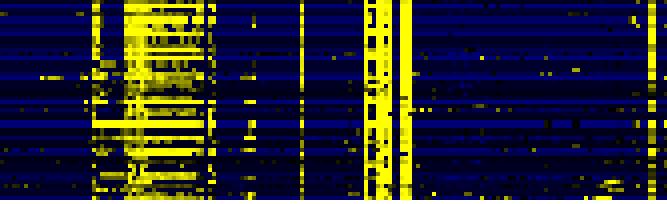
| Pathways co-expressed in the Organ and Tissue data set (with more than 15 annotation points) |
|
CYP705A13 (At2g14100) |
|
|
|
|
|
|
|
|
| max. difference between log2-ratios: |
4.5 |
|
|
|
|
|
|
|
|
|
|
|
|
| max. difference between log2-ratios excluding lowest and highest 5%: |
2.3 |
|
|
|
|
|
|
|
|
|
|
|
|
| Pathway |
Source |
Scores of Genes |
p[Score] |
No. of Genes |
p[genes] |
Link to organ heatmap |
|
|
|
|
|
|
|
| Stilbene, coumarine and lignin biosynthesis |
KEGG |
64 |
0.000 |
26 |
0.000 |
|
|
|
| Methane metabolism |
KEGG |
58 |
0.000 |
26 |
0.000 |
|
|
| Phenylalanine metabolism |
KEGG |
54 |
0.000 |
25 |
0.000 |
|
|
| Prostaglandin and leukotriene metabolism |
KEGG |
54 |
0.000 |
25 |
0.000 |
|
|
| Cell Wall Carbohydrate Metabolism |
BioPath |
43 |
0.000 |
11 |
0.047 |
|
|
| Phenylpropanoid Metabolism |
BioPath |
39 |
0.000 |
12 |
0.000 |
|
|
| mono-/sesqui-/di-terpene biosynthesis |
LitPath |
39 |
0.000 |
7 |
0.000 |
|
|
| terpenoid metabolism |
LitPath |
39 |
0.000 |
7 |
0.000 |
|
|
| triterpene, sterol, and brassinosteroid metabolism |
LitPath |
32 |
0.000 |
8 |
0.012 |
|
|
| Biosynthesis of steroids |
KEGG |
28 |
0.000 |
5 |
0.004 |
|
|
| detoxification |
FunCat |
27 |
0.000 |
10 |
0.000 |
|
|
| pectin metabolism |
BioPath |
21 |
0.000 |
8 |
0.004 |
|
|
| flavonol biosynthesis |
AraCyc |
21 |
0.000 |
6 |
0.000 |
|
|
| Glucosyltransferases for benzoic acids |
BioPath |
20 |
0.000 |
2 |
0.002 |
|
|
|
|
|
|
|
|
|
|
|
| Miscellaneous acyl lipid metabolism |
AcylLipid |
20 |
0.000 |
9 |
0.000 |
|
|
|
|
|
|
|
|
|
|
|
| triterpene biosynthesis |
LitPath |
20 |
0.000 |
3 |
0.002 |
|
|
|
|
|
|
|
|
|
|
|
| monoterpenoid biosynthesis |
TAIR-GO |
19 |
0.000 |
2 |
0.000 |
|
|
|
|
|
|
|
|
|
|
|
| monoterpene biosynthesis |
LitPath |
19 |
0.000 |
2 |
0.002 |
|
|
|
|
|
|
|
|
|
|
|
| secondary metabolism |
FunCat |
18 |
0.000 |
5 |
0.001 |
|
|
|
|
|
|
|
|
|
|
|
| Fructose and mannose metabolism |
KEGG |
18 |
0.000 |
2 |
0.210 |
|
|
|
|
|
|
|
|
|
|
|
| lactose degradation IV |
AraCyc |
16 |
0.000 |
3 |
0.000 |
|
|
|
|
|
|
|
|
|
|
|
|
|
|
|
|
|
|
|
|
|
|
|
|
|
|
|
|
|
|
|
|
|
|
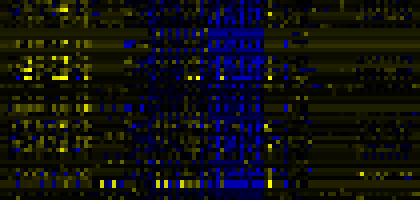
| Pathways co-expressed in the Hormone etc. data set (with more than 8 annotation points) |
|
| max. difference between log2-ratios: |
3.3 |
|
|
|
|
|
|
|
|
|
|
|
|
| max. difference between log2-ratios excluding lowest and highest 5%: |
1.6 |
|
|
|
|
|
|
|
|
|
|
|
|
| Pathway |
Source |
Scores of Genes |
p[Score] |
No. of Genes |
p[genes] |
Link to hormones etc. heatmap |
|
|
|
|
|
|
|
| Cell Wall Carbohydrate Metabolism |
BioPath |
32.5 |
0.000 |
7 |
0.034 |
|
|
|
|
|
|
| pectin metabolism |
BioPath |
22.5 |
0.000 |
6 |
0.001 |
|
|
|
|
|
| Biosynthesis of steroids |
KEGG |
19 |
0.000 |
4 |
0.000 |
|
|
|
|
|
| Phenylpropanoid Metabolism |
BioPath |
16 |
0.006 |
3 |
0.137 |
|
|
|
|
|
| triterpene, sterol, and brassinosteroid metabolism |
LitPath |
15 |
0.000 |
3 |
0.023 |
|
|
|
|
|
| flavonol biosynthesis |
AraCyc |
14 |
0.000 |
2 |
0.000 |
|
|
|
|
|
| C-compound and carbohydrate metabolism |
FunCat |
14 |
0.000 |
4 |
0.046 |
|
|
|
|
|
| Stilbene, coumarine and lignin biosynthesis |
KEGG |
14 |
0.000 |
7 |
0.000 |
|
|
|
|
|
| Methane metabolism |
KEGG |
12 |
0.000 |
6 |
0.000 |
|
|
|
|
|
| Pentose and glucuronate interconversions |
KEGG |
12 |
0.000 |
2 |
0.001 |
|
|
|
|
|
| Phenylalanine metabolism |
KEGG |
12 |
0.000 |
6 |
0.000 |
|
|
|
|
|
| Prostaglandin and leukotriene metabolism |
KEGG |
12 |
0.000 |
6 |
0.000 |
|
|
|
|
|
| Terpenoid biosynthesis |
KEGG |
12 |
0.000 |
3 |
0.000 |
|
|
|
|
|
|
|
|
|
|
|
| GDP-carbohydrate biosynthesis |
BioPath |
10 |
0.000 |
1 |
0.006 |
|
|
|
|
|
|
|
|
|
|
|
| Glucosyltransferases for benzoic acids |
BioPath |
10 |
0.000 |
1 |
0.010 |
|
|
|
|
|
|
|
|
|
|
|
| colanic acid building blocks biosynthesis |
AraCyc |
10 |
0.000 |
1 |
0.047 |
|
|
|
|
|
|
|
|
|
|
|
| dTDP-rhamnose biosynthesis |
AraCyc |
10 |
0.000 |
1 |
0.029 |
|
|
|
|
|
|
|
|
|
|
|
| galactose degradation I |
AraCyc |
10 |
0.000 |
1 |
0.001 |
|
|
|
|
|
|
|
|
|
|
|
| glucose conversion |
AraCyc |
10 |
0.000 |
1 |
0.025 |
|
|
|
|
|
|
|
|
|
|
|
| lactose degradation IV |
AraCyc |
10 |
0.000 |
1 |
0.001 |
|
|
|
|
|
|
|
|
|
|
|
| UDP-glucose conversion |
AraCyc |
10 |
0.000 |
1 |
0.024 |
|
|
|
|
|
|
|
|
|
|
|
| Fructose and mannose metabolism |
KEGG |
10 |
0.000 |
1 |
0.098 |
|
|
|
|
|
|
|
|
|
|
|
| Oxidative phosphorylation |
KEGG |
10 |
0.000 |
2 |
0.051 |
|
|
|
|
|
|
|
|
|
|
|
|
|
|
|
|
|
|
|
|
|
|
|
|
|
|
|
|
|
|
|
|
|
|
|
|
|
|
|
|
|
|
|
|
|
|
|
|
|
|
|
|
|
|
|
|
|
|
|
|
|
|
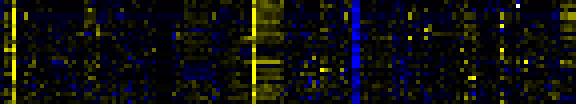
| Pathways co-expressed in the Mutant data set (with more than 8 annotation points) |
|
CYP705A13 (At2g14100) |
|
|
|
|
|
|
|
|
| max. difference between log2-ratios: |
4.3 |
|
|
|
|
|
|
|
|
|
|
|
|
| max. difference between log2-ratios excluding lowest and highest 5%: |
1.3 |
|
|
|
|
|
|
|
|
|
|
|
|
| Pathway |
Source |
Scores of Genes |
p[Score] |
No. of Genes |
p[genes] |
Link to mutants heatmap |
|
|
|
|
|
|
|
| core phenylpropanoid metabolism |
BioPath |
20 |
0.000 |
2 |
0.002 |
|
|
|
|
| Phenylpropanoid Metabolism |
BioPath |
20 |
0.000 |
2 |
0.080 |
|
|
|
| lignin biosynthesis |
TAIR-GO |
20 |
0.000 |
2 |
0.000 |
|
|
|
| lignin biosynthesis |
AraCyc |
20 |
0.000 |
2 |
0.002 |
|
|
|
| Phenylpropanoid pathway |
LitPath |
20 |
0.000 |
2 |
0.006 |
|
|
|
| Biosynthesis of Amino Acids and Derivatives |
BioPath |
14 |
0.003 |
2 |
0.074 |
|
|
|
| Methionin/SAM/ethylene metabolism from cysteine and aspartate |
BioPath |
14 |
0.000 |
2 |
0.001 |
|
|
|
| Stilbene, coumarine and lignin biosynthesis |
KEGG |
14 |
0.000 |
3 |
0.009 |
|
|
|
|
|
|
|
|
|
|
|
| Chlorophyll biosynthesis and breakdown |
BioPath |
10 |
0.000 |
1 |
0.016 |
|
|
|
|
|
|
|
|
|
|
|
| Plastidial Isoprenoids (Chlorophylls, Carotenoids, Tocopherols, Plastoquinone, Phylloquinone) |
BioPath |
10 |
0.004 |
1 |
0.087 |
|
|
|
|
|
|
|
|
|
|
|
| chlorophyll biosynthesis |
TAIR-GO |
10 |
0.000 |
1 |
0.004 |
|
|
|
|
|
|
|
|
|
|
|
| chlorophyll biosynthesis |
AraCyc |
10 |
0.000 |
1 |
0.041 |
|
|
|
|
|
|
|
|
|
|
|
| methionine and S-adenosylmethionine synthesis |
AraCyc |
10 |
0.000 |
1 |
0.001 |
|
|
|
|
|
|
|
|
|
|
|
| methionine degradation I |
AraCyc |
10 |
0.000 |
1 |
0.002 |
|
|
|
|
|
|
|
|
|
|
|
| phenylpropanoid biosynthesis |
AraCyc |
10 |
0.000 |
1 |
0.001 |
|
|
|
|
|
|
|
|
|
|
|
| suberin biosynthesis |
AraCyc |
10 |
0.000 |
1 |
0.005 |
|
|
|
|
|
|
|
|
|
|
|
| amino acid metabolism |
FunCat |
10 |
0.000 |
1 |
0.027 |
|
|
|
|
|
|
|
|
|
|
|
| Flavonoid biosynthesis |
KEGG |
10 |
0.000 |
1 |
0.008 |
|
|
|
|
|
|
|
|
|
|
|
| Inositol phosphate metabolism |
KEGG |
10 |
0.000 |
3 |
0.009 |
|
|
|
|
|
|
|
|
|
|
|
| Methionine metabolism |
KEGG |
10 |
0.000 |
1 |
0.012 |
|
|
|
|
|
|
|
|
|
|
|
| Porphyrin and chlorophyll metabolism |
KEGG |
10 |
0.000 |
1 |
0.021 |
|
|
|
|
|
|
|
|
|
|
|
| Selenoamino acid metabolism |
KEGG |
10 |
0.000 |
1 |
0.026 |
|
|
|
|
|
|
|
|
|
|
|
| chlorophyll and phytochromobilin metabolism |
LitPath |
10 |
0.000 |
1 |
0.013 |
|
|
|
|
|
|
|
|
|
|
|
| chlorophyll biosynthesis |
LitPath |
10 |
0.000 |
1 |
0.001 |
|
|
|
|
|
|
|
|
|
|
|
|
|
|
|
|
|
|
|
|
|
|
|
|
|
|
|
|