


| Co-Expression Analysis of: | CYPedia Home | Institut de Biologie Moléculaire des Plantes (Home) | ||||||||||||||
| CYP705A2 (At4g15350) | save all data as Tab Delimited Table | |||||||||||||||
| _________________________________________ |
|
|||||||||||||||
| Pathways co-expressed in the 3 data sets with co-expressed pathways (with more than 6 annotation points each) | Find below a list of pathways that are co-expressed with the bait. First a list of pathways is given that are co-expressed in all data sets. Lists for each individual dataset are shown underneath. Depending on the number of co-expressed pathways only the top scoring pathways are given; all data can be saved as text using the link above. | |||||||||||||||
| Pathway | Source | Sum of scores | Sum of genes | |||||||||||||
| terpenoid metabolism | LitPath | 28 | 7 | |||||||||||||
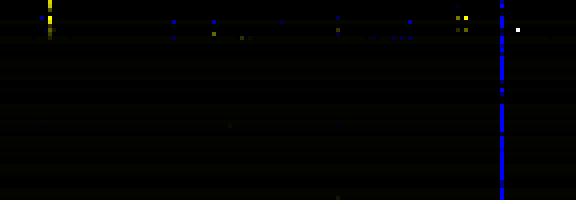
| To the right of each table a thumbnail of the actual co-expression heatmap is given. Klick on the link to see the heatmap containing all co-expressed genes. | ||||||||||||||||
| For more information on how these pathway maps were generated please read the methods page | ||||||||||||||||
| Pathways co-expressed in the Organ and Tissue data set (with more than 6 annotation points) | CYP705A2 (At4g15350) | |||||||||||||||
| max. difference between log2-ratios: | 2.8 | |||||||||||||||
| max. difference between log2-ratios excluding lowest and highest 5%: | 0.0 | |||||||||||||||
| Link to organ heatmap | ||||||||||||||||
| there are no co-expressed genes with more than 6 annotation points | ||||||||||||||||
| Pathways co-expressed in the Stress data set ( with more than 6 annotation points) | CYP705A2 (At4g15350) | |||||||||||||||
| max. difference between log2-ratios: | 5.0 | |||||||||||||||
| max. difference between log2-ratios excluding lowest and highest 5%: | 0.9 | |||||||||||||||
| Pathway | Source | Scores of Genes | p[Score] | No. of Genes | p[genes] | Link to stress heatmap | ||||||||||
| Benzoate degradation via CoA ligation | KEGG | 18 | 0.000 | 2 | 0.009 |
|
||||||||||
| Inositol phosphate metabolism | KEGG | 18 | 0.000 | 2 | 0.011 | |||||||||||
| Nicotinate and nicotinamide metabolism | KEGG | 18 | 0.000 | 2 | 0.007 | |||||||||||
| N-terminal protein myristoylation | TAIR-GO | 9 | 0.000 | 1 | 0.001 | |||||||||||
| phosphorylation | TAIR-GO | 9 | 0.000 | 1 | 0.000 | |||||||||||
| protein amino acid phosphorylation | TAIR-GO | 9 | 0.000 | 1 | 0.000 | |||||||||||
| secondary metabolism | FunCat | 9 | 0.000 | 2 | 0.000 | |||||||||||
| terpenoid metabolism | LitPath | 8 | 0.000 | 2 | 0.002 | |||||||||||
| pentacyclic triterpenoid biosynthesis | TAIR-GO | 7 | 0.000 | 1 | 0.000 | |||||||||||
| triterpene biosynthesis | LitPath | 7 | 0.000 | 1 | 0.000 | |||||||||||
| triterpene, sterol, and brassinosteroid metabolism | LitPath | 7 | 0.000 | 1 | 0.010 | |||||||||||
| Pathways co-expressed in the Hormone etc. data set (with more than 6 annotation points) | CYP705A2 (At4g15350) | |||||||||||||||
| max. difference between log2-ratios: | 4.4 | |||||||||||||||
| max. difference between log2-ratios excluding lowest and highest 5%: | 0.0 | |||||||||||||||
| Pathway | Source | Scores of Genes | p[Score] | No. of Genes | p[genes] | Link to hormones etc. heatmap | ||||||||||
| Lipid signaling | AcylLipid | 11 | 0.000 | 2 | 0.015 |
|
||||||||||
| lipases pathway | AraCyc | 9 | 0.000 | 1 | 0.000 | |||||||||||
| degradation | FunCat | 9 | 0.000 | 1 | 0.000 | |||||||||||
| intracellular signalling | FunCat | 9 | 0.000 | 1 | 0.002 | |||||||||||
| lipid, fatty acid and isoprenoid degradation | FunCat | 9 | 0.000 | 1 | 0.000 | |||||||||||
| second messenger mediated signal transduction | FunCat | 9 | 0.000 | 1 | 0.000 | |||||||||||
| mono-/sesqui-/di-terpene biosynthesis | LitPath | 8 | 0.000 | 2 | 0.002 | |||||||||||
| terpenoid metabolism | LitPath | 8 | 0.000 | 2 | 0.002 | |||||||||||
| Pathways co-expressed in the Mutant data set (with more than 15 annotation points) | CYP705A2 (At4g15350) | |||||||||||||||
| max. difference between log2-ratios: | 4.3 | |||||||||||||||
| max. difference between log2-ratios excluding lowest and highest 5%: | 0.0 | |||||||||||||||
| Pathway | Source | Scores of Genes | p[Score] | No. of Genes | p[genes] | Link to mutants heatmap | ||||||||||
| Cell Wall Carbohydrate Metabolism | BioPath | 83.5 | 0.000 | 29 | 0.000 |
|
||||||||||
| pectin metabolism | BioPath | 52.5 | 0.000 | 23 | 0.000 | |||||||||||
| Ribosome | KEGG | 38 | 0.000 | 7 | 0.161 | |||||||||||
| Phenylpropanoid Metabolism | BioPath | 33 | 0.002 | 8 | 0.189 | |||||||||||
| nucleotide metabolism | FunCat | 28 | 0.000 | 6 | 0.000 | |||||||||||
| Nucleotide Metabolism | KEGG | 24 | 0.000 | 5 | 0.005 | |||||||||||
| Pyrimidine metabolism | KEGG | 24 | 0.000 | 5 | 0.000 | |||||||||||
| triterpene, sterol, and brassinosteroid metabolism | LitPath | 23 | 0.015 | 7 | 0.034 | |||||||||||
| (deoxy)ribose phosphate degradation | AraCyc | 20 | 0.000 | 4 | 0.000 | |||||||||||
| pyrimidine nucleotide metabolism | FunCat | 20 | 0.000 | 4 | 0.000 | |||||||||||
| biogenesis of cell wall | FunCat | 18 | 0.000 | 7 | 0.001 | |||||||||||
| Lipid signaling | AcylLipid | 18 | 0.002 | 4 | 0.311 | |||||||||||
| transcription | FunCat | 17 | 0.000 | 4 | 0.000 | |||||||||||
| Aromatic amino acid (Phe, Tyr, Trp) metabolism | BioPath | 16 | 0.001 | 2 | 0.338 | |||||||||||
| Phenylalanine, tyrosine and tryptophan biosynthesis | KEGG | 16 | 0.000 | 2 | 0.061 | |||||||||||
| Shikimate pathway | LitPath | 16 | 0.028 | 2 | 0.424 | |||||||||||
| page created by Juergen Ehlting | 06/07/06 | |||||||||||||||