|
|
|
|
|
|
|
|
|
|
|
|
|
|
|
|
|
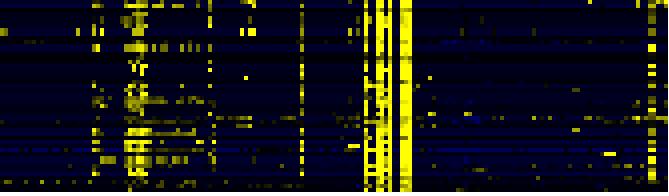
| Pathways co-expressed in the Organ and Tissue data set (with more than 6 annotation points) |
|
CYP705A20 (At3g20110) |
|
|
|
|
|
|
|
|
| max. difference between log2-ratios: |
4.8 |
|
|
|
|
|
|
|
|
|
|
|
|
| max. difference between log2-ratios excluding lowest and highest 5%: |
3.0 |
|
|
|
|
|
|
|
|
|
|
|
|
| Pathway |
Source |
Scores of Genes |
p[Score] |
No. of Genes |
p[genes] |
Link to organ heatmap |
|
|
|
|
|
|
|
| Cell Wall Carbohydrate Metabolism |
BioPath |
31 |
0.000 |
7 |
0.004 |
|
|
|
| cellulose biosynthesis |
BioPath |
20 |
0.000 |
3 |
0.000 |
|
|
| Glycerolipid metabolism |
KEGG |
20 |
0.000 |
3 |
0.001 |
|
|
| Methane metabolism |
KEGG |
18 |
0.000 |
8 |
0.000 |
|
|
| hemicellulose biosynthesis |
BioPath |
16 |
0.000 |
2 |
0.000 |
|
|
| Fructose and mannose metabolism |
KEGG |
16 |
0.000 |
2 |
0.016 |
|
|
| Glycan Biosynthesis and Metabolism |
KEGG |
16 |
0.000 |
2 |
0.037 |
|
|
| Phenylalanine metabolism |
KEGG |
14 |
0.000 |
7 |
0.000 |
|
|
| Prostaglandin and leukotriene metabolism |
KEGG |
14 |
0.000 |
7 |
0.000 |
|
|
| Stilbene, coumarine and lignin biosynthesis |
KEGG |
14 |
0.000 |
7 |
0.000 |
|
|
| Phenylpropanoid Metabolism |
BioPath |
12 |
0.011 |
3 |
0.050 |
|
|
| pectin metabolism |
BioPath |
11 |
0.000 |
4 |
0.006 |
|
|
| flavonol biosynthesis |
AraCyc |
11 |
0.000 |
2 |
0.000 |
|
|
|
|
|
|
|
|
|
|
|
| Glucosyltransferases for benzoic acids |
BioPath |
10 |
0.000 |
1 |
0.005 |
|
|
|
|
|
|
|
|
|
|
|
| gibberellic acid biosynthesis |
TAIR-GO |
9 |
0.000 |
1 |
0.000 |
|
|
|
|
|
|
|
|
|
|
|
| gibberellin biosynthesis |
AraCyc |
9 |
0.000 |
1 |
0.001 |
|
|
|
|
|
|
|
|
|
|
|
|
|
|
|
|
|
|
|
|
|
|
|
|
|
|
|
|
|
|
|
|
|
|
|
|
|
|
|
|
|
|
|
|
|
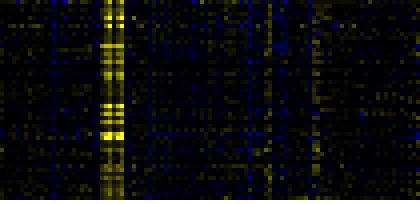
| Pathways co-expressed in the Stress data set ( with more than 6 annotation points) |
|
CYP705A20 (At3g20110) |
|
|
|
|
|
|
|
|
| max. difference between log2-ratios: |
4.5 |
|
|
|
|
|
|
|
|
|
|
|
|
| max. difference between log2-ratios excluding lowest and highest 5%: |
1.8 |
|
|
|
|
|
|
|
|
|
|
|
|
| Pathway |
Source |
Scores of Genes |
p[Score] |
No. of Genes |
p[genes] |
Link to stress heatmap |
|
|
|
|
|
|
|
| Cell Wall Carbohydrate Metabolism |
BioPath |
18.5 |
0.000 |
4 |
0.032 |

|
| C-compound and carbohydrate metabolism |
FunCat |
15 |
0.000 |
3 |
0.040 |
| Fructose and mannose metabolism |
KEGG |
12 |
0.000 |
2 |
0.001 |
| trehalose biosynthesis |
TAIR-GO |
9 |
0.000 |
1 |
0.000 |
| trehalose biosynthesis I |
AraCyc |
9 |
0.000 |
1 |
0.009 |
| trehalose biosynthesis II |
AraCyc |
9 |
0.000 |
1 |
0.005 |
|
|
|
|
|
|
|
|
|
|
|
| trehalose biosynthesis III |
AraCyc |
9 |
0.000 |
1 |
0.002 |
|
|
|
|
|
|
|
|
|
|
|
| energy |
FunCat |
9 |
0.000 |
1 |
0.000 |
|
|
|
|
|
|
|
|
|
|
|
| metabolism of energy reserves (e.g. glycogen, trehalose) |
FunCat |
9 |
0.000 |
1 |
0.000 |
|
|
|
|
|
|
|
|
|
|
|
| cellulose biosynthesis |
BioPath |
8 |
0.000 |
1 |
0.026 |
|
|
|
|
|
|
|
|
|
|
|
| hemicellulose biosynthesis |
BioPath |
8 |
0.000 |
1 |
0.003 |
|
|
|
|
|
|
|
|
|
|
|
| Glycan Biosynthesis and Metabolism |
KEGG |
8 |
0.000 |
1 |
0.030 |
|
|
|
|
|
|
|
|
|
|
|
| Glycerolipid metabolism |
KEGG |
8 |
0.000 |
1 |
0.009 |
|
|
|
|
|
|
|
|
|
|
|
| mono-/sesqui-/di-terpene biosynthesis |
LitPath |
8 |
0.000 |
2 |
0.001 |
|
|
|
|
|
|
|
|
|
|
|
| terpenoid metabolism |
LitPath |
8 |
0.000 |
2 |
0.001 |
|
|
|
|
|
|
|
|
|
|
|
| pectin metabolism |
BioPath |
6.5 |
0.001 |
2 |
0.048 |
|
|
|
|
|
|
|
|
|
|
|
|
|
|
|
|
|
|
|
|
|
|
|
|
|
|
|
|
|
|
|
|
|
|
|
|
|
|
|
|
|
|
|
|
|
| Pathways co-expressed in the Hormone etc. data set (with more than 10 annotation points) |
|
CYP705A20 (At3g20110) |
|
|
|
|
|
|
|
|
| max. difference between log2-ratios: |
4.8 |
|
|
|
|
|
|
|
|
|
|
|
|
| max. difference between log2-ratios excluding lowest and highest 5%: |
2.0 |
|
|
|
|
|
|
|
|
|
|
|
|
| Pathway |
Source |
Scores of Genes |
p[Score] |
No. of Genes |
p[genes] |
Link to hormones etc. heatmap |
|
|
|
|
|
|
|
| Ribosome |
KEGG |
46 |
0.000 |
9 |
0.006 |
|
|
|
|
|
|
| protein synthesis |
FunCat |
26 |
0.000 |
5 |
0.006 |
|
|
|
|
|
| Nucleotide Metabolism |
KEGG |
24 |
0.000 |
3 |
0.032 |
|
|
|
|
|
| Purine metabolism |
KEGG |
24 |
0.000 |
3 |
0.015 |
|
|
|
|
|
| Intermediary Carbon Metabolism |
BioPath |
22 |
0.000 |
4 |
0.012 |
|
|
|
|
|
| colanic acid building blocks biosynthesis |
AraCyc |
22 |
0.000 |
5 |
0.001 |
|
|
|
|
|
| Fructose and mannose metabolism |
KEGG |
20.5 |
0.000 |
5 |
0.000 |
|
|
|
|
|
| acetate fermentation |
AraCyc |
19 |
0.000 |
3 |
0.056 |
|
|
|
|
|
| fructose degradation (anaerobic) |
AraCyc |
19 |
0.000 |
3 |
0.044 |
|
|
|
|
|
| glycolysis IV |
AraCyc |
19 |
0.000 |
3 |
0.046 |
|
|
|
|
|
| sorbitol fermentation |
AraCyc |
19 |
0.000 |
3 |
0.051 |
|
|
|
|
|
| Gluconeogenesis from lipids in seeds |
BioPath |
18 |
0.000 |
3 |
0.003 |
|
|
|
|
|
| GDP-D-rhamnose biosynthesis |
AraCyc |
18 |
0.000 |
3 |
0.000 |
|
|
|
|
|
| de novo biosynthesis of purine nucleotides I |
AraCyc |
16 |
0.004 |
2 |
0.282 |
|
|
|
|
|
|
|
|
|
|
|
| de novo biosynthesis of purine nucleotides II |
AraCyc |
16 |
0.000 |
2 |
0.037 |
|
|
|
|
|
|
|
|
|
|
|
| formaldehyde assimilation I (serine pathway) |
AraCyc |
16 |
0.000 |
2 |
0.032 |
|
|
|
|
|
|
|
|
|
|
|
| gluconeogenesis |
AraCyc |
16 |
0.000 |
2 |
0.070 |
|
|
|
|
|
|
|
|
|
|
|
| serine-isocitrate lyase pathway |
AraCyc |
16 |
0.000 |
2 |
0.070 |
|
|
|
|
|
|
|
|
|
|
|
| amino acid metabolism |
FunCat |
16 |
0.017 |
2 |
0.160 |
|
|
|
|
|
|
|
|
|
|
|
| Alanine and aspartate metabolism |
KEGG |
16 |
0.000 |
2 |
0.013 |
|
|
|
|
|
|
|
|
|
|
|
| nucleotide metabolism |
FunCat |
15 |
0.000 |
2 |
0.000 |
|
|
|
|
|
|
|
|
|
|
|
| purine nucleotide metabolism |
FunCat |
15 |
0.000 |
2 |
0.003 |
|
|
|
|
|
|
|
|
|
|
|
| mannitol degradation |
AraCyc |
13 |
0.000 |
2 |
0.015 |
|
|
|
|
|
|
|
|
|
|
|
| sorbitol degradation |
AraCyc |
13 |
0.000 |
2 |
0.017 |
|
|
|
|
|
|
|
|
|
|
|
| GDP-carbohydrate biosynthesis |
BioPath |
12 |
0.000 |
2 |
0.000 |
|
|
|
|
|
|
|
|
|
|
|
| tRNA charging pathway |
AraCyc |
12 |
0.000 |
3 |
0.017 |
|
|
|
|
|
|
|
|
|
|
|
| tricarboxylic-acid pathway (citrate cycle, Krebs cycle, TCA cycle) |
FunCat |
12 |
0.037 |
2 |
0.154 |
|
|
|
|
|
|
|
|
|
|
|
| Aminoacyl-tRNA biosynthesis |
KEGG |
12 |
0.000 |
3 |
0.004 |
|
|
|
|
|
|
|
|
|
|
|
| Pyruvate metabolism |
KEGG |
12 |
0.031 |
2 |
0.106 |
|
|
|
|
|
|
|
|
|
|
|
| transport |
FunCat |
11 |
0.000 |
2 |
0.000 |
|
|
|
|
|
|
|
|
|
|
|
| Oxidative phosphorylation |
KEGG |
11 |
0.004 |
2 |
0.109 |
|
|
|
|
|
|
|
|
|
|
|
|
|
|
|
|
|
|
|
|
|
|
|
|
|
|
|
|
|
|
|
|
|
|
|
|
|
|
|
|
|
|
|
|
|
|
|
|
|
|
|
|
|
|
|
|
|
|
|
|
|
|
| Pathways co-expressed in the Mutant data set (with more than 6 annotation points) |
|
CYP705A20 (At3g20110) |
|
|
|
|
|
|
|
|
| max. difference between log2-ratios: |
4.8 |
|
|
|
|
|
|
|
|
|
|
|
|
| max. difference between log2-ratios excluding lowest and highest 5%: |
2.3 |
|
|
|
|
|
|
|
|
|
|
|
|
| Pathway |
Source |
Scores of Genes |
p[Score] |
No. of Genes |
p[genes] |
Link to mutants heatmap |
|
|
|
|
|
|
|
| Intermediary Carbon Metabolism |
BioPath |
10 |
0.000 |
1 |
0.031 |

|
|
|
|
| glyoxylate cycle |
AraCyc |
10 |
0.000 |
1 |
0.002 |
|
|
|
| TCA cycle variation VII |
AraCyc |
10 |
0.000 |
1 |
0.015 |
|
|
|
|
|
|
|
|
|
|
|
| TCA cycle variation VIII |
AraCyc |
10 |
0.000 |
1 |
0.008 |
|
|
|
|
|
|
|
|
|
|
|
| glycolysis and gluconeogenesis |
FunCat |
10 |
0.000 |
1 |
0.001 |
|
|
|
|
|
|
|
|
|
|
|
| glyoxylate cycle |
FunCat |
10 |
0.000 |
1 |
0.000 |
|
|
|
|
|
|
|
|
|
|
|
| Glyoxylate and dicarboxylate metabolism |
KEGG |
10 |
0.000 |
1 |
0.000 |
|
|
|
|
|
|
|
|
|
|
|
| Pyruvate metabolism |
KEGG |
10 |
0.000 |
1 |
0.000 |
|
|
|
|
|
|
|
|
|
|
|
| fatty acid beta oxidation complex |
BioPath |
7 |
0.000 |
1 |
0.001 |
|
|
|
|
|
|
|
|
|
|
|
| Gluconeogenesis from lipids in seeds |
BioPath |
7 |
0.000 |
1 |
0.006 |
|
|
|
|
|
|
|
|
|
|
|
| fatty acid beta-oxidation |
TAIR-GO |
7 |
0.000 |
1 |
0.000 |
|
|
|
|
|
|
|
|
|
|
|
| fatty acid oxidation pathway |
AraCyc |
7 |
0.000 |
1 |
0.001 |
|
|
|
|
|
|
|
|
|
|
|
| isoleucine degradation I |
AraCyc |
7 |
0.000 |
1 |
0.002 |
|
|
|
|
|
|
|
|
|
|
|
| isoleucine degradation III |
AraCyc |
7 |
0.000 |
1 |
0.000 |
|
|
|
|
|
|
|
|
|
|
|
| leucine degradation I |
AraCyc |
7 |
0.000 |
1 |
0.002 |
|
|
|
|
|
|
|
|
|
|
|
| leucine degradation II |
AraCyc |
7 |
0.000 |
1 |
0.000 |
|
|
|
|
|
|
|
|
|
|
|
| valine degradation I |
AraCyc |
7 |
0.000 |
1 |
0.004 |
|
|
|
|
|
|
|
|
|
|
|
| valine degradation II |
AraCyc |
7 |
0.000 |
1 |
0.001 |
|
|
|
|
|
|
|
|
|
|
|
| Degradation of storage lipids and straight fatty acids |
AcylLipid |
7 |
0.000 |
1 |
0.000 |
|
|
|
|
|
|
|
|
|
|
|
|
|
|
|
|
|
|
|
|
|
|
|
|
|
|
|
|