|
|
|
|
|
|
|
|
|
|
|
|
|
|
|
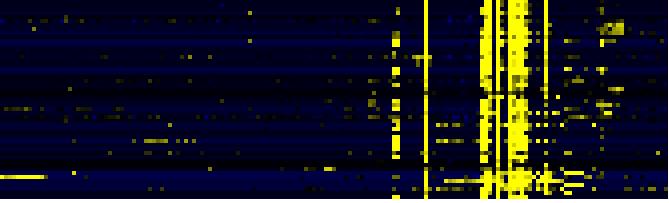
| Pathways co-expressed in the Organ and Tissue data set (with more than 6 annotation points) |
|
CYP705A24 (At1g28430) |
|
|
|
|
|
|
| max. difference between log2-ratios: |
7.5 |
|
|
|
|
|
|
|
|
|
|
| max. difference between log2-ratios excluding lowest and highest 5%: |
4.2 |
|
|
|
|
|
|
|
|
|
|
| Pathway |
Source |
Scores of Genes |
p[Score] |
No. of Genes |
p[genes] |
Link to organ heatmap |
|
|
|
|
|
| Miscellaneous acyl lipid metabolism |
AcylLipid |
44 |
0.000 |
16 |
0.000 |
|
| Fatty acid elongation and wax and cutin metabolism |
AcylLipid |
29 |
0.000 |
6 |
0.026 |
| Isoprenoid Biosynthesis in the Cytosol and in Mitochondria |
BioPath |
22 |
0.000 |
4 |
0.000 |
| fatty acid metabolism |
TAIR-GO |
22 |
0.000 |
3 |
0.000 |
| Cell Wall Carbohydrate Metabolism |
BioPath |
20 |
0.001 |
5 |
0.131 |
| sexual reproduction |
TAIR-GO |
20 |
0.000 |
5 |
0.000 |
| Biosynthesis of prenyl diphosphates |
BioPath |
14 |
0.000 |
3 |
0.001 |
| triacylglycerol degradation |
AraCyc |
14 |
0.000 |
6 |
0.000 |
| C-compound and carbohydrate metabolism |
FunCat |
14 |
0.027 |
3 |
0.302 |
| polyisoprenoid biosynthesis |
AraCyc |
12 |
0.000 |
3 |
0.000 |
| Galactose metabolism |
KEGG |
12 |
0.000 |
2 |
0.001 |
| Starch and sucrose metabolism |
KEGG |
12 |
0.000 |
3 |
0.001 |
| gibberellic acid catabolism |
TAIR-GO |
10 |
0.000 |
1 |
0.001 |
| Diterpenoid biosynthesis |
KEGG |
10 |
0.000 |
1 |
0.002 |
|
|
|
|
|
|
|
|
|
| Gibberellin metabolism |
LitPath |
10 |
0.000 |
1 |
0.024 |
|
|
|
|
|
|
|
|
|
| giberelin catabolism |
LitPath |
10 |
0.000 |
1 |
0.000 |
|
|
|
|
|
|
|
|
|
| prenyl diphosphate (GPP,FPP, GGPP) biosynthesis |
LitPath |
10 |
0.000 |
1 |
0.019 |
|
|
|
|
|
|
|
|
|
| lignin biosynthesis |
AraCyc |
9 |
0.000 |
4 |
0.000 |
|
|
|
|
|
|
|
|
|
| Phenylpropanoid pathway |
LitPath |
9 |
0.011 |
4 |
0.003 |
|
|
|
|
|
|
|
|
|
| pectin metabolism |
BioPath |
8 |
0.003 |
2 |
0.206 |
|
|
|
|
|
|
|
|
|
| ubiquinone biosynthesis |
BioPath |
8 |
0.000 |
1 |
0.001 |
|
|
|
|
|
|
|
|
|
| biosynthesis of proto- and siroheme |
AraCyc |
8 |
0.000 |
1 |
0.042 |
|
|
|
|
|
|
|
|
|
| mevalonate pathway |
AraCyc |
8 |
0.000 |
1 |
0.010 |
|
|
|
|
|
|
|
|
|
| metabolism of vitamins, cofactors, and prosthetic groups |
FunCat |
8 |
0.000 |
1 |
0.001 |
|
|
|
|
|
|
|
|
|
| Oxidative phosphorylation |
KEGG |
8 |
0.000 |
2 |
0.009 |
|
|
|
|
|
|
|
|
|
| Ubiquinone biosynthesis |
KEGG |
8 |
0.000 |
1 |
0.002 |
|
|
|
|
|
|
|
|
|
| ubiquinone biosynthesis |
LitPath |
8 |
0.000 |
1 |
0.001 |
|
|
|
|
|
|
|
|
|
| suberin biosynthesis |
AraCyc |
7 |
0.000 |
3 |
0.000 |
|
|
|
|
|
|
|
|
|
|
|
|
|
|
|
|
|
|
|
|
|
|
|
|
|
|
|
|
|
|
|
|
|
|
|
|
|
|
|
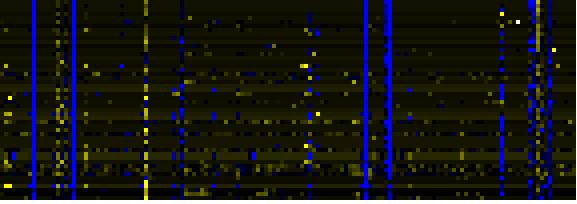
| Pathways co-expressed in the Hormone etc. data set (with more than 6 annotation points) |
|
CYP705A24 (At1g28430) |
|
|
|
|
|
|
| max. difference between log2-ratios: |
1.0 |
|
|
|
|
|
|
|
|
|
|
| max. difference between log2-ratios excluding lowest and highest 5%: |
0.0 |
|
|
|
|
|
|
|
|
|
|
| Pathway |
Source |
Scores of Genes |
p[Score] |
No. of Genes |
p[genes] |
Link to hormones etc. heatmap |
|
|
|
|
|
| Cell Wall Carbohydrate Metabolism |
BioPath |
18 |
0.000 |
3 |
0.011 |

|
|
|
|
| RNA polymerase |
KEGG |
15 |
0.000 |
2 |
0.000 |
|
|
|
| Transcription |
KEGG |
15 |
0.000 |
2 |
0.002 |
|
|
|
| Fructose and mannose metabolism |
KEGG |
14 |
0.000 |
2 |
0.001 |
|
|
|
| cellulose biosynthesis |
BioPath |
10 |
0.000 |
1 |
0.007 |
|
|
|
|
|
|
|
|
|
| hemicellulose biosynthesis |
BioPath |
10 |
0.000 |
1 |
0.001 |
|
|
|
|
|
|
|
|
|
| Glycan Biosynthesis and Metabolism |
KEGG |
10 |
0.000 |
1 |
0.021 |
|
|
|
|
|
|
|
|
|
| Glycerolipid metabolism |
KEGG |
10 |
0.000 |
1 |
0.006 |
|
|
|
|
|
|
|
|
|
| DNA methylation |
TAIR-GO |
9 |
0.000 |
1 |
0.000 |
|
|
|
|
|
|
|
|
|
| nuclear heterochromatin |
TAIR-GO |
9 |
0.000 |
1 |
0.000 |
|
|
|
|
|
|
|
|
|
| RNA interference, production of siRNA |
TAIR-GO |
9 |
0.000 |
1 |
0.000 |
|
|
|
|
|
|
|
|
|
|
|
|
|
|
|
|
|
|
|
|
|
|
|
|
|
|
|
|
|
|
|
|
|
|
|
|
|
|
|
|
|
|
|
|
|
|
|
|
|
|
|
|
|
|
| Pathways co-expressed in the Mutant data set (with more than 10 annotation points) |
|
CYP705A24 (At1g28430) |
|
|
|
|
|
|
| max. difference between log2-ratios: |
8.4 |
|
|
|
|
|
|
|
|
|
|
| max. difference between log2-ratios excluding lowest and highest 5%: |
1.4 |
|
|
|
|
|
|
|
|
|
|
| Pathway |
Source |
Scores of Genes |
p[Score] |
No. of Genes |
p[genes] |
Link to mutants heatmap |
|
|
|
|
|
| Cell Wall Carbohydrate Metabolism |
BioPath |
87 |
0.000 |
20 |
0.000 |
|
|
| pectin metabolism |
BioPath |
69 |
0.000 |
17 |
0.000 |
|
| Miscellaneous acyl lipid metabolism |
AcylLipid |
54 |
0.000 |
17 |
0.000 |
|
| Starch and sucrose metabolism |
KEGG |
39 |
0.000 |
6 |
0.000 |
|
| C-compound and carbohydrate metabolism |
FunCat |
36 |
0.001 |
11 |
0.013 |
|
| Phenylpropanoid pathway |
LitPath |
29 |
0.000 |
6 |
0.000 |
|
| biogenesis of cell wall |
FunCat |
24 |
0.000 |
8 |
0.000 |
|
| core phenylpropanoid metabolism |
BioPath |
22 |
0.000 |
3 |
0.020 |
|
| Galactose metabolism |
KEGG |
22 |
0.000 |
3 |
0.001 |
|
| Isoprenoid Biosynthesis in the Cytosol and in Mitochondria |
BioPath |
20 |
0.000 |
3 |
0.058 |
|
| sexual reproduction |
TAIR-GO |
20 |
0.000 |
5 |
0.000 |
|
| Glycan Biosynthesis and Metabolism |
KEGG |
18 |
0.000 |
3 |
0.008 |
|
| sucrose metabolism |
BioPath |
16 |
0.000 |
2 |
0.009 |
|
|
|
|
|
|
|
|
|
| glycolysis and gluconeogenesis |
FunCat |
16 |
0.031 |
4 |
0.121 |
|
|
|
|
|
|
|
|
|
| Fatty acid elongation and wax and cutin metabolism |
AcylLipid |
16 |
0.033 |
4 |
0.278 |
|
|
|
|
|
|
|
|
|
| Glutamate/glutamine from nitrogen fixation |
BioPath |
14 |
0.000 |
2 |
0.003 |
|
|
|
|
|
|
|
|
|
| fatty acid metabolism |
TAIR-GO |
14 |
0.000 |
3 |
0.000 |
|
|
|
|
|
|
|
|
|
| long-chain fatty acid metabolism |
TAIR-GO |
14 |
0.000 |
3 |
0.000 |
|
|
|
|
|
|
|
|
|
| very-long-chain fatty acid metabolism |
TAIR-GO |
14 |
0.000 |
3 |
0.000 |
|
|
|
|
|
|
|
|
|
| lactose degradation IV |
AraCyc |
14 |
0.000 |
4 |
0.000 |
|
|
|
|
|
|
|
|
|
| assimilation of ammonia, metabolism of the glutamate group |
FunCat |
14 |
0.000 |
2 |
0.011 |
|
|
|
|
|
|
|
|
|
| nitrogen and sulfur metabolism |
FunCat |
14 |
0.000 |
2 |
0.009 |
|
|
|
|
|
|
|
|
|
| Glutamate metabolism |
KEGG |
14 |
0.000 |
2 |
0.017 |
|
|
|
|
|
|
|
|
|
| Nitrogen metabolism |
KEGG |
14 |
0.000 |
2 |
0.008 |
|
|
|
|
|
|
|
|
|
| Oxidative phosphorylation |
KEGG |
14 |
0.000 |
3 |
0.014 |
|
|
|
|
|
|
|
|
|
| Biosynthesis of prenyl diphosphates |
BioPath |
12 |
0.010 |
2 |
0.082 |
|
|
|
|
|
|
|
|
|
| triacylglycerol degradation |
AraCyc |
12 |
0.000 |
5 |
0.000 |
|
|
|
|
|
|
|
|
|
| C-compound and carbohydrate utilization |
FunCat |
12 |
0.000 |
2 |
0.000 |
|
|
|
|
|
|
|
|
|
|
|
|
|
|
|
|
|
|
|
|
|
|
|
|