| _________________________________________ |
|
|
|
|
|
|
|
|

|
|
|
|
|
|
|
| Pathways co-expressed in all 4 data sets (with more than 6 annotation points each) |
|
Find below a list of pathways that are co-expressed with the bait. First a list of pathways is given that are co-expressed in all data sets. Lists for each individual dataset are shown underneath. Depending on the number of co-expressed pathways only the top scoring pathways are given; all data can be saved as text using the link above. |
|
|
|
|
|
|
| Pathway |
Source |
Sum of scores |
Sum of genes |
|
|
|
|
|
|
|
| Stilbene, coumarine and lignin biosynthesis |
KEGG |
108 |
38 |
|
|
|
|
|
|
|
|
|
|
|
|
|
|
|
|
|
|
|
|
|
|
|
|
|
|
|
|
|
|
|
|
|
|
|
|
To the right of each table a thumbnail of the actual co-expression heatmap is given. Klick on the link to see the heatmap containing all co-expressed genes. |
|
|
|
|
|
|
|
|
|
|
|
|
|
|
|
|
|
|
|
|
|
|
|
|
|
|
|
|
|
|
|
|
|
|
|
|
|
|
|
For more information on how these pathway maps were generated please read the methods page |
|
|
|
|
|
|
|
|
|
|
|
|
|
|
|
|
|
|
|
|
|
|
|
|
|
|
|
|
|
|
|
|
|
|
|
|
|
|
|
|
|
|
|
|
|
|
|
|
|
|
|
|
|
|
|
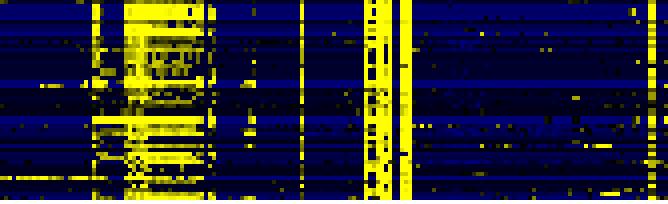
| Pathways co-expressed in the Organ and Tissue data set (with more than 15 annotation points) |
|
CYP705A25 (At1g50560) |
|
|
|
|
|
|
|
|
| max. difference between log2-ratios: |
4.7 |
|
|
|
|
|
|
|
|
|
|
|
|
| max. difference between log2-ratios excluding lowest and highest 5%: |
2.6 |
|
|
|
|
|
|
|
|
|
|
|
|
| Pathway |
Source |
Scores of Genes |
p[Score] |
No. of Genes |
p[genes] |
Link to organ heatmap |
|
|
|
|
|
|
|
| Stilbene, coumarine and lignin biosynthesis |
KEGG |
64 |
0.000 |
26 |
0.000 |
|
|
|
| Phenylalanine metabolism |
KEGG |
63 |
0.000 |
26 |
0.000 |
|
|
| Methane metabolism |
KEGG |
58 |
0.000 |
26 |
0.000 |
|
|
| Prostaglandin and leukotriene metabolism |
KEGG |
54 |
0.000 |
25 |
0.000 |
|
|
| Cell Wall Carbohydrate Metabolism |
BioPath |
43 |
0.000 |
11 |
0.028 |
|
|
| Phenylpropanoid Metabolism |
BioPath |
35 |
0.000 |
10 |
0.000 |
|
|
| mono-/sesqui-/di-terpene biosynthesis |
LitPath |
35 |
0.000 |
6 |
0.001 |
|
|
| terpenoid metabolism |
LitPath |
35 |
0.000 |
6 |
0.001 |
|
|
| triterpene, sterol, and brassinosteroid metabolism |
LitPath |
32 |
0.000 |
8 |
0.006 |
|
|
| Biosynthesis of steroids |
KEGG |
28 |
0.000 |
5 |
0.007 |
|
|
| detoxification |
FunCat |
27 |
0.000 |
10 |
0.000 |
|
|
| lactose degradation IV |
AraCyc |
22 |
0.000 |
4 |
0.000 |
|
|
| pectin metabolism |
BioPath |
21 |
0.000 |
8 |
0.002 |
|
|
| flavonol biosynthesis |
AraCyc |
21 |
0.000 |
6 |
0.000 |
|
|
|
|
|
|
|
|
|
|
|
| Glucosyltransferases for benzoic acids |
BioPath |
20 |
0.000 |
2 |
0.002 |
|
|
|
|
|
|
|
|
|
|
|
| triterpene biosynthesis |
LitPath |
20 |
0.000 |
3 |
0.001 |
|
|
|
|
|
|
|
|
|
|
|
| monoterpenoid biosynthesis |
TAIR-GO |
19 |
0.000 |
2 |
0.000 |
|
|
|
|
|
|
|
|
|
|
|
| monoterpene biosynthesis |
LitPath |
19 |
0.000 |
2 |
0.001 |
|
|
|
|
|
|
|
|
|
|
|
| colanic acid building blocks biosynthesis |
AraCyc |
18 |
0.000 |
3 |
0.014 |
|
|
|
|
|
|
|
|
|
|
|
| dTDP-rhamnose biosynthesis |
AraCyc |
18 |
0.000 |
3 |
0.005 |
|
|
|
|
|
|
|
|
|
|
|
| galactose degradation I |
AraCyc |
18 |
0.000 |
3 |
0.000 |
|
|
|
|
|
|
|
|
|
|
|
| glucose conversion |
AraCyc |
18 |
0.000 |
3 |
0.004 |
|
|
|
|
|
|
|
|
|
|
|
| UDP-glucose conversion |
AraCyc |
18 |
0.000 |
3 |
0.004 |
|
|
|
|
|
|
|
|
|
|
|
| secondary metabolism |
FunCat |
18 |
0.000 |
5 |
0.001 |
|
|
|
|
|
|
|
|
|
|
|
| Fructose and mannose metabolism |
KEGG |
18 |
0.000 |
2 |
0.247 |
|
|
|
|
|
|
|
|
|
|
|
| Miscellaneous acyl lipid metabolism |
AcylLipid |
16 |
0.000 |
7 |
0.002 |
|
|
|
|
|
|
|
|
|
|
|
|
|
|
|
|
|
|
|
|
|
|
|
|
|
|
|
|
|
|
|
|
|
|
|
|
|
|
|
|
|
|
|
|
|
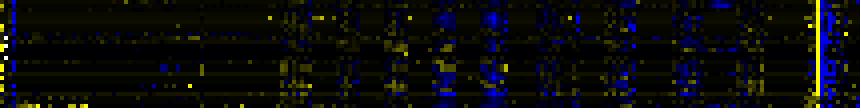
| Pathways co-expressed in the Stress data set ( with more than 6 annotation points) |
|
CYP705A25 (At1g50560) |
|
|
|
|
|
|
|
|
| max. difference between log2-ratios: |
6.4 |
|
|
|
|
|
|
|
|
|
|
|
|
| max. difference between log2-ratios excluding lowest and highest 5%: |
1.1 |
|
|
|
|
|
|
|
|
|
|
|
|
| Pathway |
Source |
Scores of Genes |
p[Score] |
No. of Genes |
p[genes] |
Link to stress heatmap |
|
|
|
|
|
|
|
| Stilbene, coumarine and lignin biosynthesis |
KEGG |
26 |
0.000 |
7 |
0.000 |
|
| detoxification |
FunCat |
16 |
0.000 |
4 |
0.000 |
| Methane metabolism |
KEGG |
16 |
0.000 |
6 |
0.000 |
| Phenylalanine metabolism |
KEGG |
16 |
0.000 |
6 |
0.000 |
| Prostaglandin and leukotriene metabolism |
KEGG |
16 |
0.000 |
6 |
0.000 |
| flavonol biosynthesis |
AraCyc |
12 |
0.000 |
2 |
0.000 |
| Glucosyltransferases for benzoic acids |
BioPath |
10 |
0.000 |
1 |
0.000 |
| Intermediary Carbon Metabolism |
BioPath |
10 |
0.000 |
1 |
0.031 |
|
|
|
|
|
|
|
|
|
|
|
| Phenylpropanoid Metabolism |
BioPath |
10 |
0.000 |
1 |
0.037 |
|
|
|
|
|
|
|
|
|
|
|
| fatty acid metabolism |
TAIR-GO |
10 |
0.000 |
1 |
0.002 |
|
|
|
|
|
|
|
|
|
|
|
| acetyl-CoA assimilation |
AraCyc |
10 |
0.000 |
1 |
0.012 |
|
|
|
|
|
|
|
|
|
|
|
| glyoxylate cycle |
AraCyc |
10 |
0.000 |
1 |
0.006 |
|
|
|
|
|
|
|
|
|
|
|
| leucine biosynthesis |
AraCyc |
10 |
0.000 |
1 |
0.003 |
|
|
|
|
|
|
|
|
|
|
|
| serine-isocitrate lyase pathway |
AraCyc |
10 |
0.000 |
1 |
0.023 |
|
|
|
|
|
|
|
|
|
|
|
| TCA cycle -- aerobic respiration |
AraCyc |
10 |
0.000 |
1 |
0.025 |
|
|
|
|
|
|
|
|
|
|
|
| TCA cycle variation VII |
AraCyc |
10 |
0.000 |
1 |
0.051 |
|
|
|
|
|
|
|
|
|
|
|
| TCA cycle variation VIII |
AraCyc |
10 |
0.000 |
1 |
0.027 |
|
|
|
|
|
|
|
|
|
|
|
| C-compound and carbohydrate glyoxylate cycle |
FunCat |
10 |
0.000 |
1 |
0.000 |
|
|
|
|
|
|
|
|
|
|
|
| detoxification involving cytochrome P450 |
FunCat |
10 |
0.000 |
1 |
0.001 |
|
|
|
|
|
|
|
|
|
|
|
| glyoxylate cycle |
FunCat |
10 |
0.000 |
1 |
0.000 |
|
|
|
|
|
|
|
|
|
|
|
| tricarboxylic-acid pathway (citrate cycle, Krebs cycle, TCA cycle) |
FunCat |
10 |
0.000 |
1 |
0.064 |
|
|
|
|
|
|
|
|
|
|
|
| Ascorbate and aldarate metabolism |
KEGG |
10 |
0.000 |
1 |
0.017 |
|
|
|
|
|
|
|
|
|
|
|
| Citrate cycle (TCA cycle) |
KEGG |
10 |
0.000 |
1 |
0.044 |
|
|
|
|
|
|
|
|
|
|
|
| Fluorene degradation |
KEGG |
10 |
0.000 |
1 |
0.006 |
|
|
|
|
|
|
|
|
|
|
|
| gamma-Hexachlorocyclohexane degradation |
KEGG |
10 |
0.000 |
1 |
0.008 |
|
|
|
|
|
|
|
|
|
|
|
| Glyoxylate and dicarboxylate metabolism |
KEGG |
10 |
0.000 |
1 |
0.022 |
|
|
|
|
|
|
|
|
|
|
|
| Reductive carboxylate cycle (CO2 fixation) |
KEGG |
10 |
0.000 |
1 |
0.011 |
|
|
|
|
|
|
|
|
|
|
|
| Fatty acid elongation and wax and cutin metabolism |
AcylLipid |
10 |
0.000 |
1 |
0.104 |
|
|
|
|
|
|
|
|
|
|
|
| fatty acid modulation |
LitPath |
10 |
0.000 |
1 |
0.000 |
|
|
|
|
|
|
|
|
|
|
|
| storage protein |
FunCat |
8 |
0.000 |
2 |
0.000 |
|
|
|
|
|
|
|
|
|
|
|
| Lipid signaling |
AcylLipid |
8 |
0.048 |
2 |
0.102 |
|
|
|
|
|
|
|
|
|
|
|
|
|
|
|
|
|
|
|
|
|
|
|
|
|
|
|
|
|
|
|
|
|
|
|
|
|
|
|
|
|
|
|
|
|
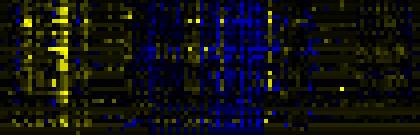
| Pathways co-expressed in the Hormone etc. data set (with more than 6 annotation points) |
|
CYP705A25 (At1g50560) |
|
|
|
|
|
|
|
|
| max. difference between log2-ratios: |
2.2 |
|
|
|
|
|
|
|
|
|
|
|
|
| max. difference between log2-ratios excluding lowest and highest 5%: |
1.3 |
|
|
|
|
|
|
|
|
|
|
|
|
| Pathway |
Source |
Scores of Genes |
p[Score] |
No. of Genes |
p[genes] |
Link to hormones etc. heatmap |
|
|
|
|
|
|
|
| Biosynthesis of steroids |
KEGG |
15 |
0.000 |
3 |
0.000 |
|
|
|
|
|
|
| triterpene, sterol, and brassinosteroid metabolism |
LitPath |
11 |
0.000 |
2 |
0.067 |
|
|
|
|
|
| tryptophan catabolism |
TAIR-GO |
10 |
0.000 |
1 |
0.000 |
|
|
|
|
|
| glucosinolate biosynthesis from tryptophan |
AraCyc |
10 |
0.000 |
1 |
0.000 |
|
|
|
|
|
| IAA biosynthesis |
AraCyc |
10 |
0.000 |
1 |
0.001 |
|
|
|
|
|
| IAA biosynthesis I |
AraCyc |
10 |
0.000 |
1 |
0.001 |
|
|
|
|
|
| Glucosinolate Metabolism |
LitPath |
10 |
0.000 |
1 |
0.029 |
|
|
|
|
|
| storage protein |
FunCat |
8 |
0.000 |
2 |
0.000 |
|
|
|
|
|
| Methane metabolism |
KEGG |
8 |
0.000 |
4 |
0.000 |
|
|
|
|
|
| Phenylalanine metabolism |
KEGG |
8 |
0.000 |
4 |
0.000 |
|
|
|
|
|
|
|
|
|
|
|
| Prostaglandin and leukotriene metabolism |
KEGG |
8 |
0.000 |
4 |
0.000 |
|
|
|
|
|
|
|
|
|
|
|
| Stilbene, coumarine and lignin biosynthesis |
KEGG |
8 |
0.000 |
4 |
0.000 |
|
|
|
|
|
|
|
|
|
|
|
| Terpenoid biosynthesis |
KEGG |
8 |
0.000 |
2 |
0.000 |
|
|
|
|
|
|
|
|
|
|
|
| Lipid signaling |
AcylLipid |
8 |
0.000 |
2 |
0.050 |
|
|
|
|
|
|
|
|
|
|
|
| pentacyclic triterpenoid biosynthesis |
TAIR-GO |
7 |
0.000 |
1 |
0.000 |
|
|
|
|
|
|
|
|
|
|
|
| secondary metabolism |
FunCat |
7 |
0.000 |
1 |
0.037 |
|
|
|
|
|
|
|
|
|
|
|
| triterpene biosynthesis |
LitPath |
7 |
0.000 |
1 |
0.008 |
|
|
|
|
|
|
|
|
|
|
|
|
|
|
|
|
|
|
|
|
|
|
|
|
|
|
|
|
|
|
|
|
|
|
|
|
|
|
|
|
|
|
|
|
|
|
|
|
|
|
|
|
|
|
|
|
|
|
|
|
|
|
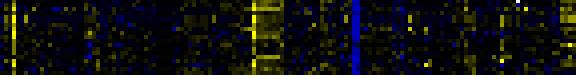
| Pathways co-expressed in the Mutant data set (with more than 6 annotation points) |
|
CYP705A25 (At1g50560) |
|
|
|
|
|
|
|
|
| max. difference between log2-ratios: |
3.4 |
|
|
|
|
|
|
|
|
|
|
|
|
| max. difference between log2-ratios excluding lowest and highest 5%: |
1.5 |
|
|
|
|
|
|
|
|
|
|
|
|
| Pathway |
Source |
Scores of Genes |
p[Score] |
No. of Genes |
p[genes] |
Link to mutants heatmap |
|
|
|
|
|
|
|
| Pyruvate metabolism |
KEGG |
16 |
0.000 |
4 |
0.000 |
|
|
|
|
| Biosynthesis of Amino Acids and Derivatives |
BioPath |
14 |
0.000 |
2 |
0.035 |
|
|
|
| Methionin/SAM/ethylene metabolism from cysteine and aspartate |
BioPath |
14 |
0.000 |
2 |
0.000 |
|
|
|
| Butanoate metabolism |
KEGG |
12 |
0.000 |
3 |
0.000 |
|
|
|
| core phenylpropanoid metabolism |
BioPath |
10 |
0.000 |
1 |
0.017 |
|
|
|
| Phenylpropanoid Metabolism |
BioPath |
10 |
0.006 |
1 |
0.180 |
|
|
|
|
|
|
|
|
|
|
|
| lignin biosynthesis |
TAIR-GO |
10 |
0.000 |
1 |
0.000 |
|
|
|
|
|
|
|
|
|
|
|
| lignin biosynthesis |
AraCyc |
10 |
0.000 |
1 |
0.009 |
|
|
|
|
|
|
|
|
|
|
|
| methionine and S-adenosylmethionine synthesis |
AraCyc |
10 |
0.000 |
1 |
0.000 |
|
|
|
|
|
|
|
|
|
|
|
| methionine degradation I |
AraCyc |
10 |
0.000 |
1 |
0.000 |
|
|
|
|
|
|
|
|
|
|
|
| amino acid metabolism |
FunCat |
10 |
0.000 |
1 |
0.033 |
|
|
|
|
|
|
|
|
|
|
|
| C-compound and carbohydrate metabolism |
FunCat |
10 |
0.000 |
3 |
0.004 |
|
|
|
|
|
|
|
|
|
|
|
| Fatty acid metabolism |
KEGG |
10 |
0.000 |
2 |
0.002 |
|
|
|
|
|
|
|
|
|
|
|
| Glycolysis / Gluconeogenesis |
KEGG |
10 |
0.000 |
3 |
0.002 |
|
|
|
|
|
|
|
|
|
|
|
| Methionine metabolism |
KEGG |
10 |
0.000 |
1 |
0.009 |
|
|
|
|
|
|
|
|
|
|
|
| Selenoamino acid metabolism |
KEGG |
10 |
0.000 |
1 |
0.020 |
|
|
|
|
|
|
|
|
|
|
|
| Stilbene, coumarine and lignin biosynthesis |
KEGG |
10 |
0.000 |
1 |
0.167 |
|
|
|
|
|
|
|
|
|
|
|
| Phenylpropanoid pathway |
LitPath |
10 |
0.000 |
1 |
0.037 |
|
|
|
|
|
|
|
|
|
|
|
| Lipid signaling |
AcylLipid |
8 |
0.004 |
2 |
0.102 |
|
|
|
|
|
|
|
|
|
|
|
|
|
|
|
|
|
|
|
|
|
|
|
|
|
|
|
|